Crop Detection – Zindi ML Challenge

Table of Contents

1. Introduction

Hosted on the Zindi Data Science and Machine Learning platform, the “Radiant Earth Spot the Crop Challenge” challenges participants to correctly predict the type of crop grown on fields in South Africa, based on Sentinel 2 imagery.

Since many computer vision, earth observation and machine learning experts take part in the challenge and compete for 8800 US$, my expectation was just to gain some experience with large datasets. With the calendar quite full already with academic duties, I still decided to take part and play with the data for a bit.

2. Data

The acquisition period for the training and testing data was between April and November 2017. Provided with STAC jsons, each band of each observation is in a single tiff image, sorted in folders by tiles and acquisition dates.

Figure 1: Example of a tif holding band information.
Figure 2: Example of tif holding field IDs, colored by individual fields.

The total dataset (training and testing) was over 80GB, with over 1,800,000 individual tifs of over 1100 tiles for the training dataset and almost 1,900,000 tifs for 2650 tiles for the testing dataset.

3. Workflow

Diagram 1: Flowchart of Workflow.

Most of the workflow is dedicated to reading the inout data and transforming it into a table holding the average monthly vegetation indices per field. Then, some visualizations are made and the final prediction performed.

3.1 Preprocessing of Data

Unfortunately, the data is provided in a projection for the northern hemisphere. In order to sample rasters based on polygons, rasterio requires all images (both datasets and and all data types) to be properly projected. For that to work, a script was created that finds all the tif files recursively in a subdirectory and converts all files ending in ‘.tif’ to ESPG:22234. Also, rasterio can only handle signed data types, therefore all field ID tifs had their data type changed.

The reprojecting and changing of the datatype took about 6 days on my JupyterHub Server. Additionally, the old images were deleted in order to save disc space.

3.2 Changing of table structure and sampling of Fields

The table was restructured to hold each Field ID as a row (observation), saving the truth-value and location of the tif files and their dates as attributes of the observations. TO make that possible, every Field ID tif had to be opened and the Field ID values vectorized and exported as vectors. Since the table is in geopandas format, the previously extracted Field ID geometries are also contained in WKT format and used later to sample the according images.

Then, for every first 3 observations per month that were cloud-free, the representative tif was sampled and the average of the reflectance value extracted for each band.


3.3 Calculation of Vegetation Indices

Based on the sampled reflectance values, the following vegetation indexes (taken from indexdatabase.de) were calculated and averaged per month:


3.4 Visualization of Reflectance Values

In order to see the development of the indexes over the course of several months, the values are plotted by class and index.

Figure 4: Average monthly reflectance values for each index, visualized by class.

3.5 Prediction

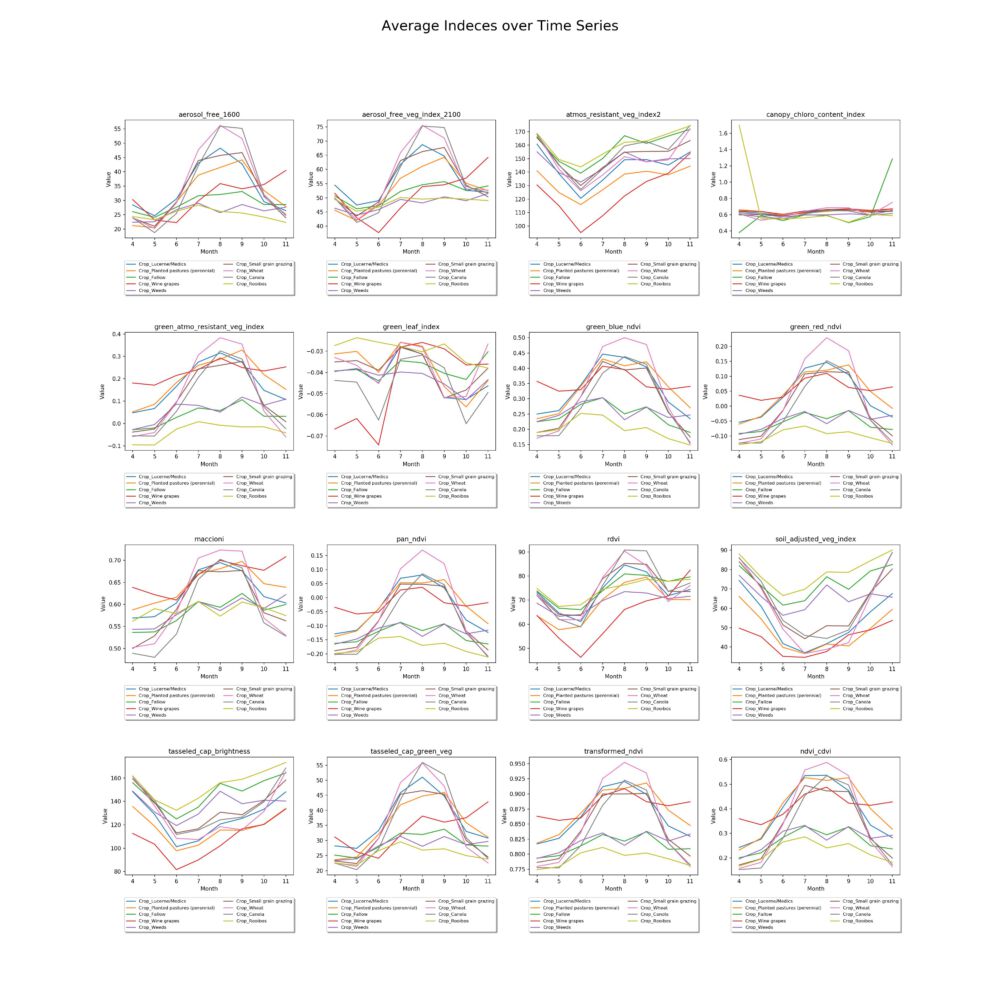
The prediction itself, based on the aforementioned vegetation indices, was performed with a random forest classifier. THe probablities of the classification were extracted with the predict_proba function, that returns a likelihood based on the proportinal results of the individual decision trees in the random forest.

3.5.1 Evaluation

The evaluation metric for this challenge is Cross Entropy with binary outcome for each crop.
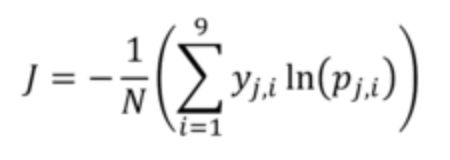
In which:

  • j indicates the field number (j=1 to N)
  • N indicates total number of fields in the dataset (87,347 in the train and 35,389 in the test)
  • i indicates the crop type (i=1 to 9)
  • y_j,i is the binary (0, 1) indicator for crop type i in field j (each field has only one correct crop type)
  • p_j,i is the predicted probability (between 0 and 1) for crop type i in field j

The final accuracy, as calculated on completely unseen data in the Zindi backend, is 1.2411. That puts my solution in place 41 out of 102 participants.

Bildschirmfoto 2021-10-14 um 13.44.27

Leave a Reply

Your email address will not be published. Required fields are marked *

Further Reading
Recent Updates