


Table of Contents
Report
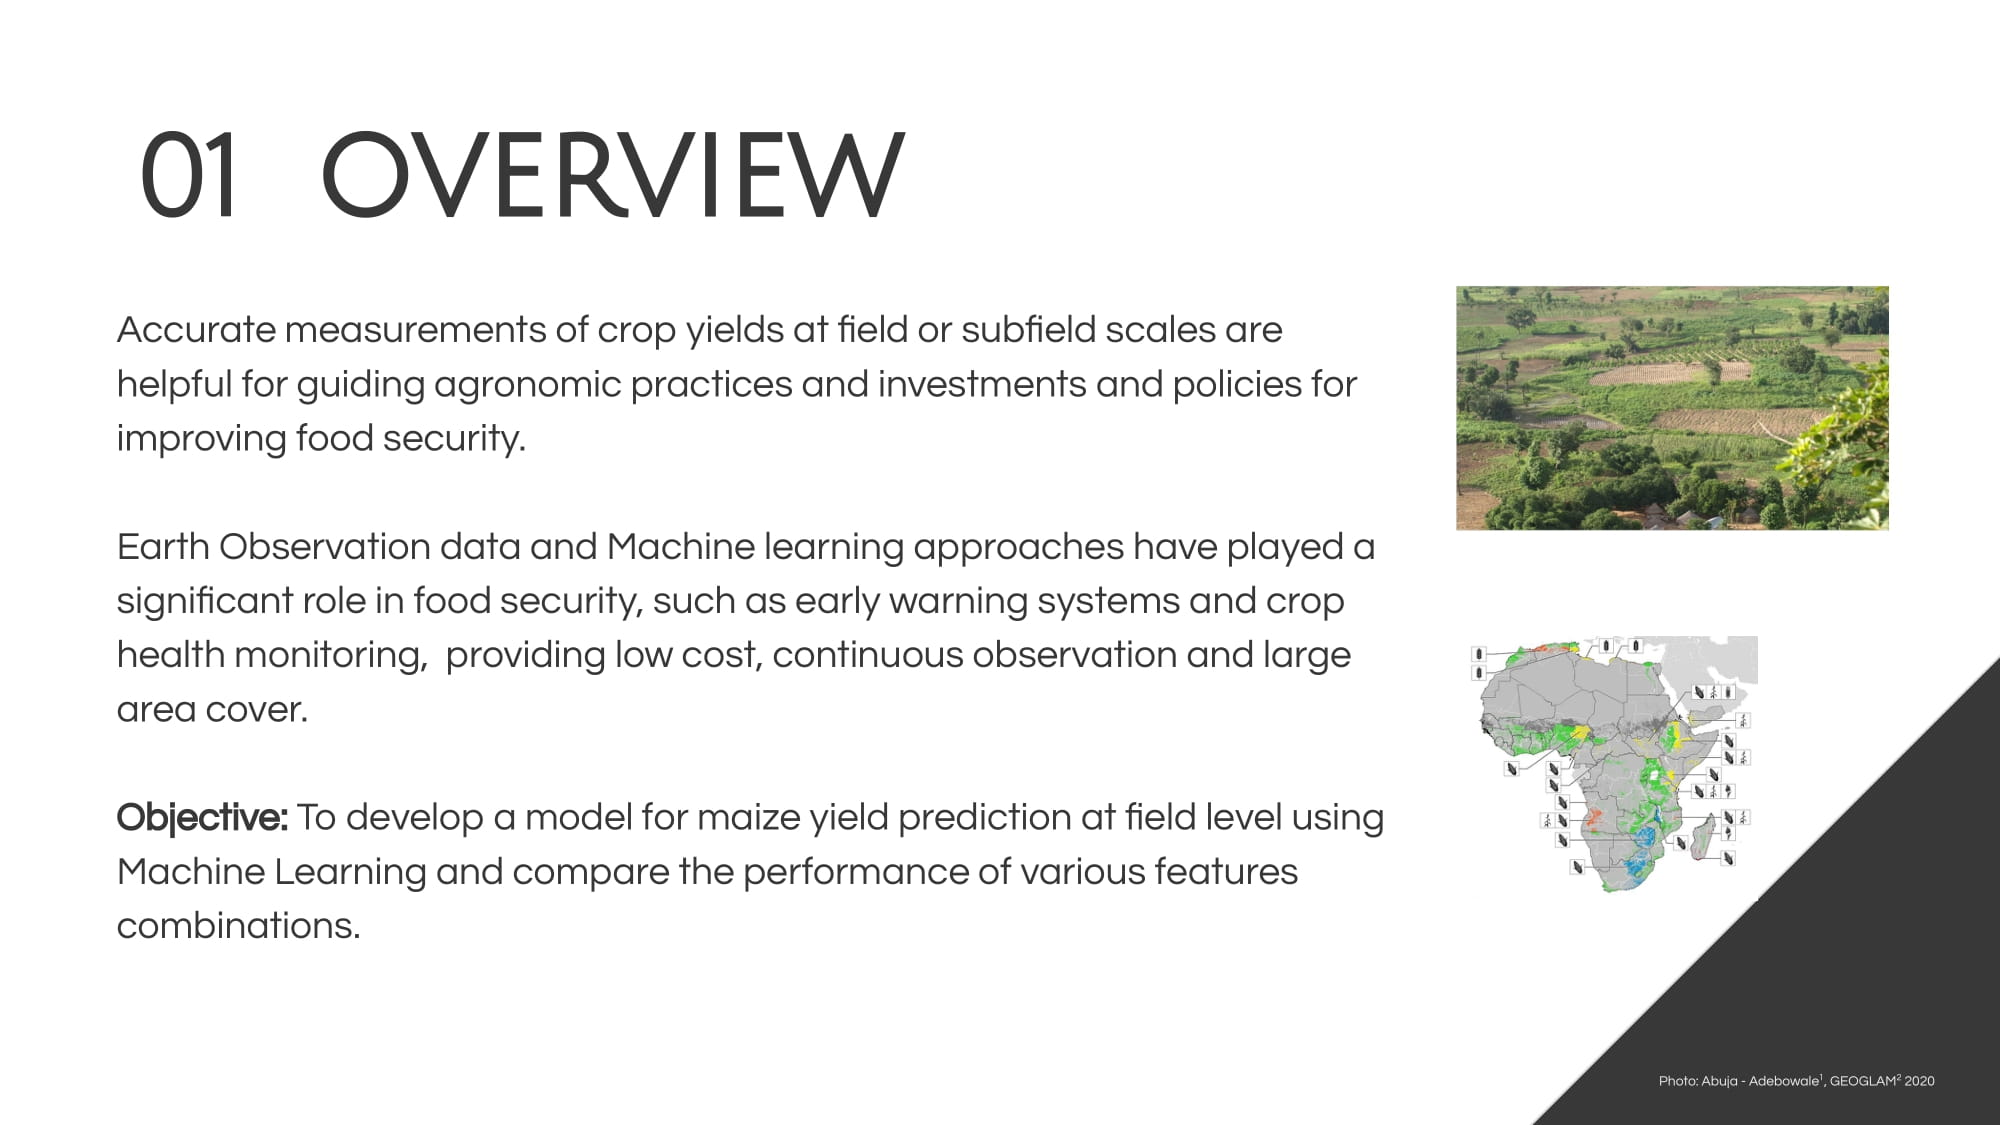
Introduction
Lecture Sessions
The summer school started with an interesting collection of application cases. Several lecturers presented their work and research, explaining not only their goals and current status, but also the data, methodology and concepts behind their archievments. Especially interesting was the talk on Urban Ecosystems. Personally, my focus is usually either on rural areas (for e.g. agriculture or forest mapping) or human settlements (e.g. to map their expansion). Focusing on the vegetation within a city is a concept that was new to me from the perspective of EO, but obviously every urban citizen is aware of the effects of vegetation within cities (both physical, as in cooling the environment down, but also aesthetically). Seeing how AI can be used to help map urban vegetation is very interesting, especially the inclusion of both multi- and hyperspectral data as well as fusing this information with LiDAR measurements.
Since research can be often times quite far removed from the average citizen, the inclusion of interested persons by creating citizen science has the potential to create more interest and understanding in the population for sciences and ecological problems.
Group Work

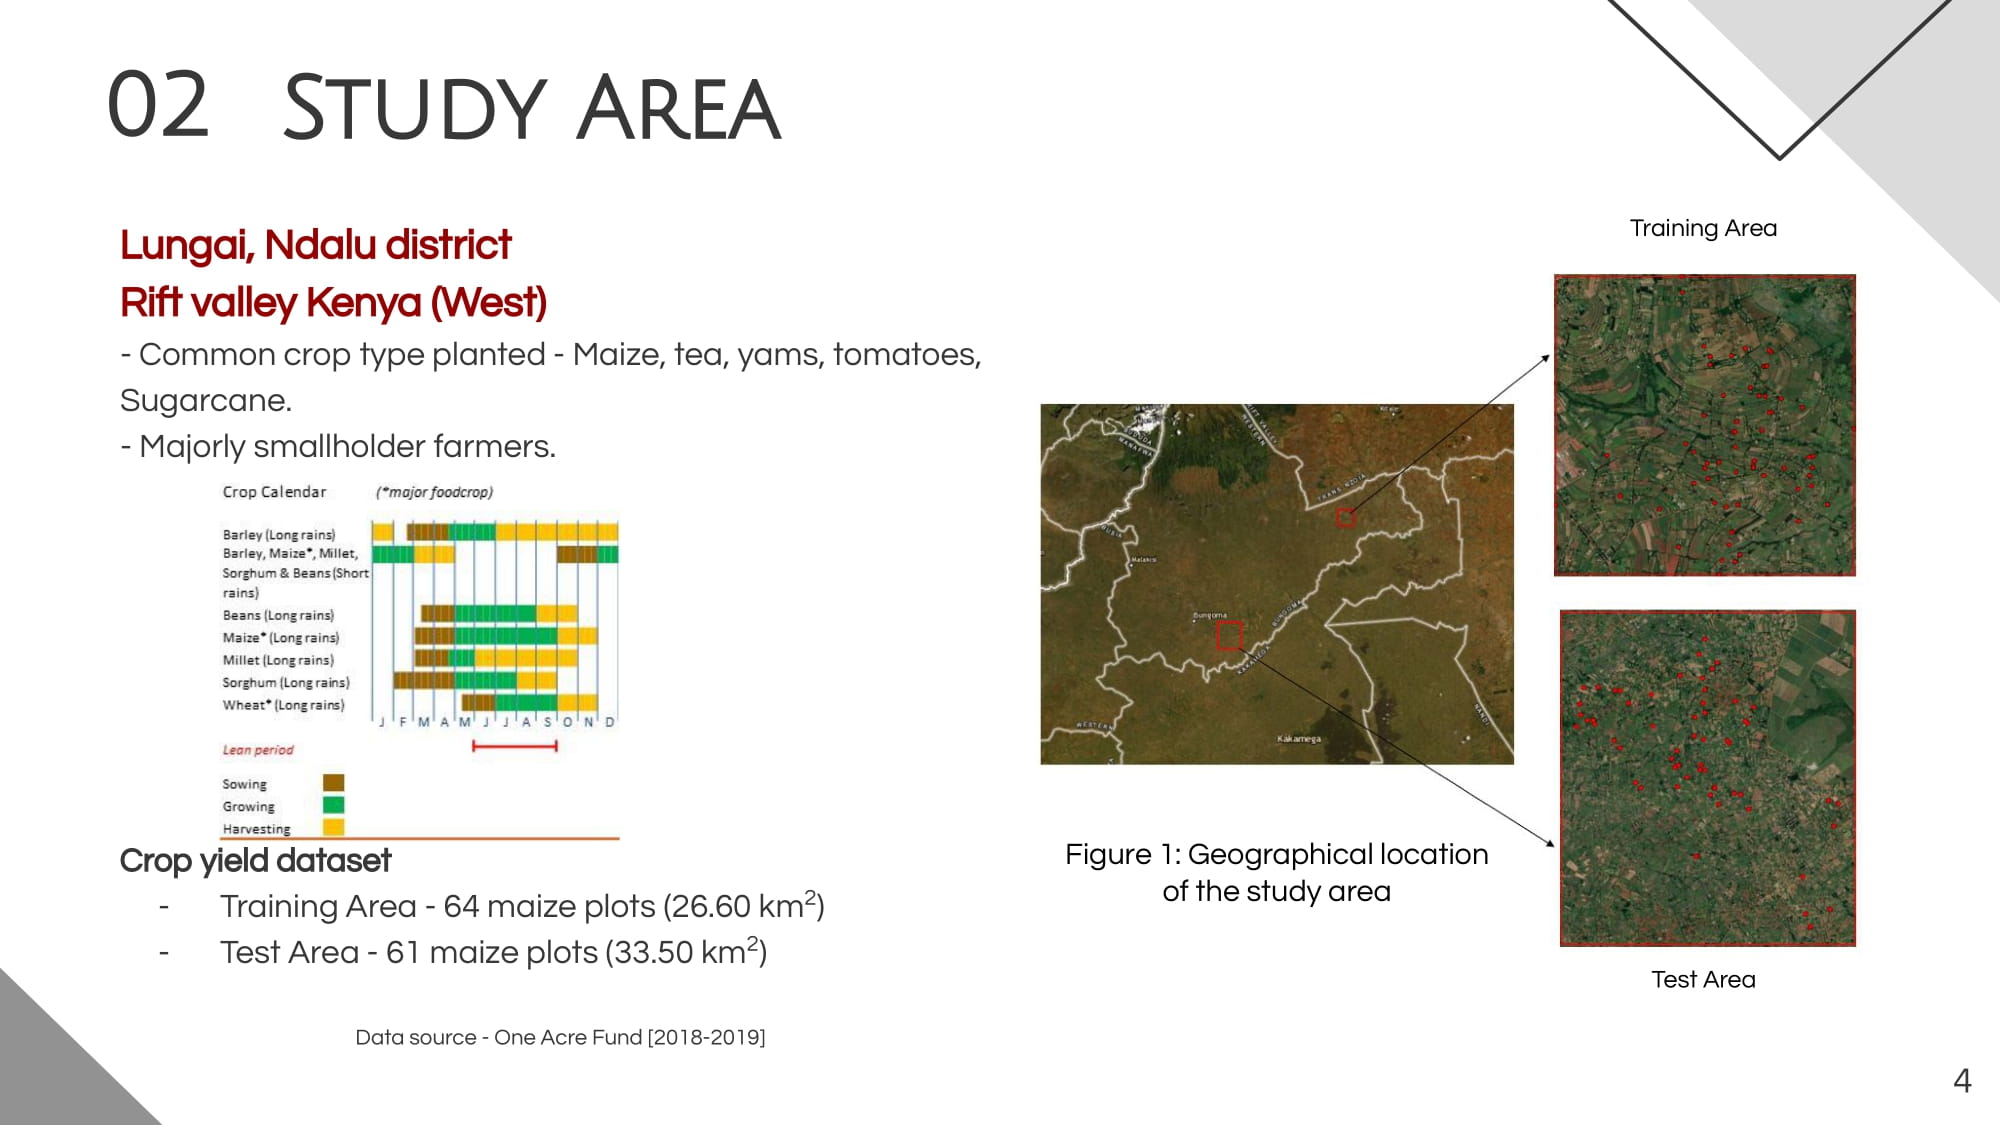
by Adebowale Adebayo
The study area is located in Lungai, Ndalu district, western rift valley of Kenya. The crop yield data were collected for the 2018 growing season for 64 maize fields spread in an area of approximately 26.6 km2. Based on the descriptive data analysis, the crop yield ranges from 3.32 t/ha to 11.02 t/ha, with an average of 5.43 t/ha. The test area contains 61 maize fields with a total area of 33.5 km2. Three Ground Range Detected (GRD) Sentinel-1 SAR products were downloaded from Copernicus Open Hub Access between July and September 2018. Data were coregistered, radiometrically calibrated, and then converted to a dB scale using SNAP 8.0.0. We also applied a five-by-five Lee speckle filter and a Range Doppler Terrain Correction to reduce spectral noise and orthorectify the data. After that, the VV, VH, VH/VV, and VV-VH bands were retrieved from SAR data, and corresponding multiple values to sampling sites were extracted to be integrated as independent covariates in the model.
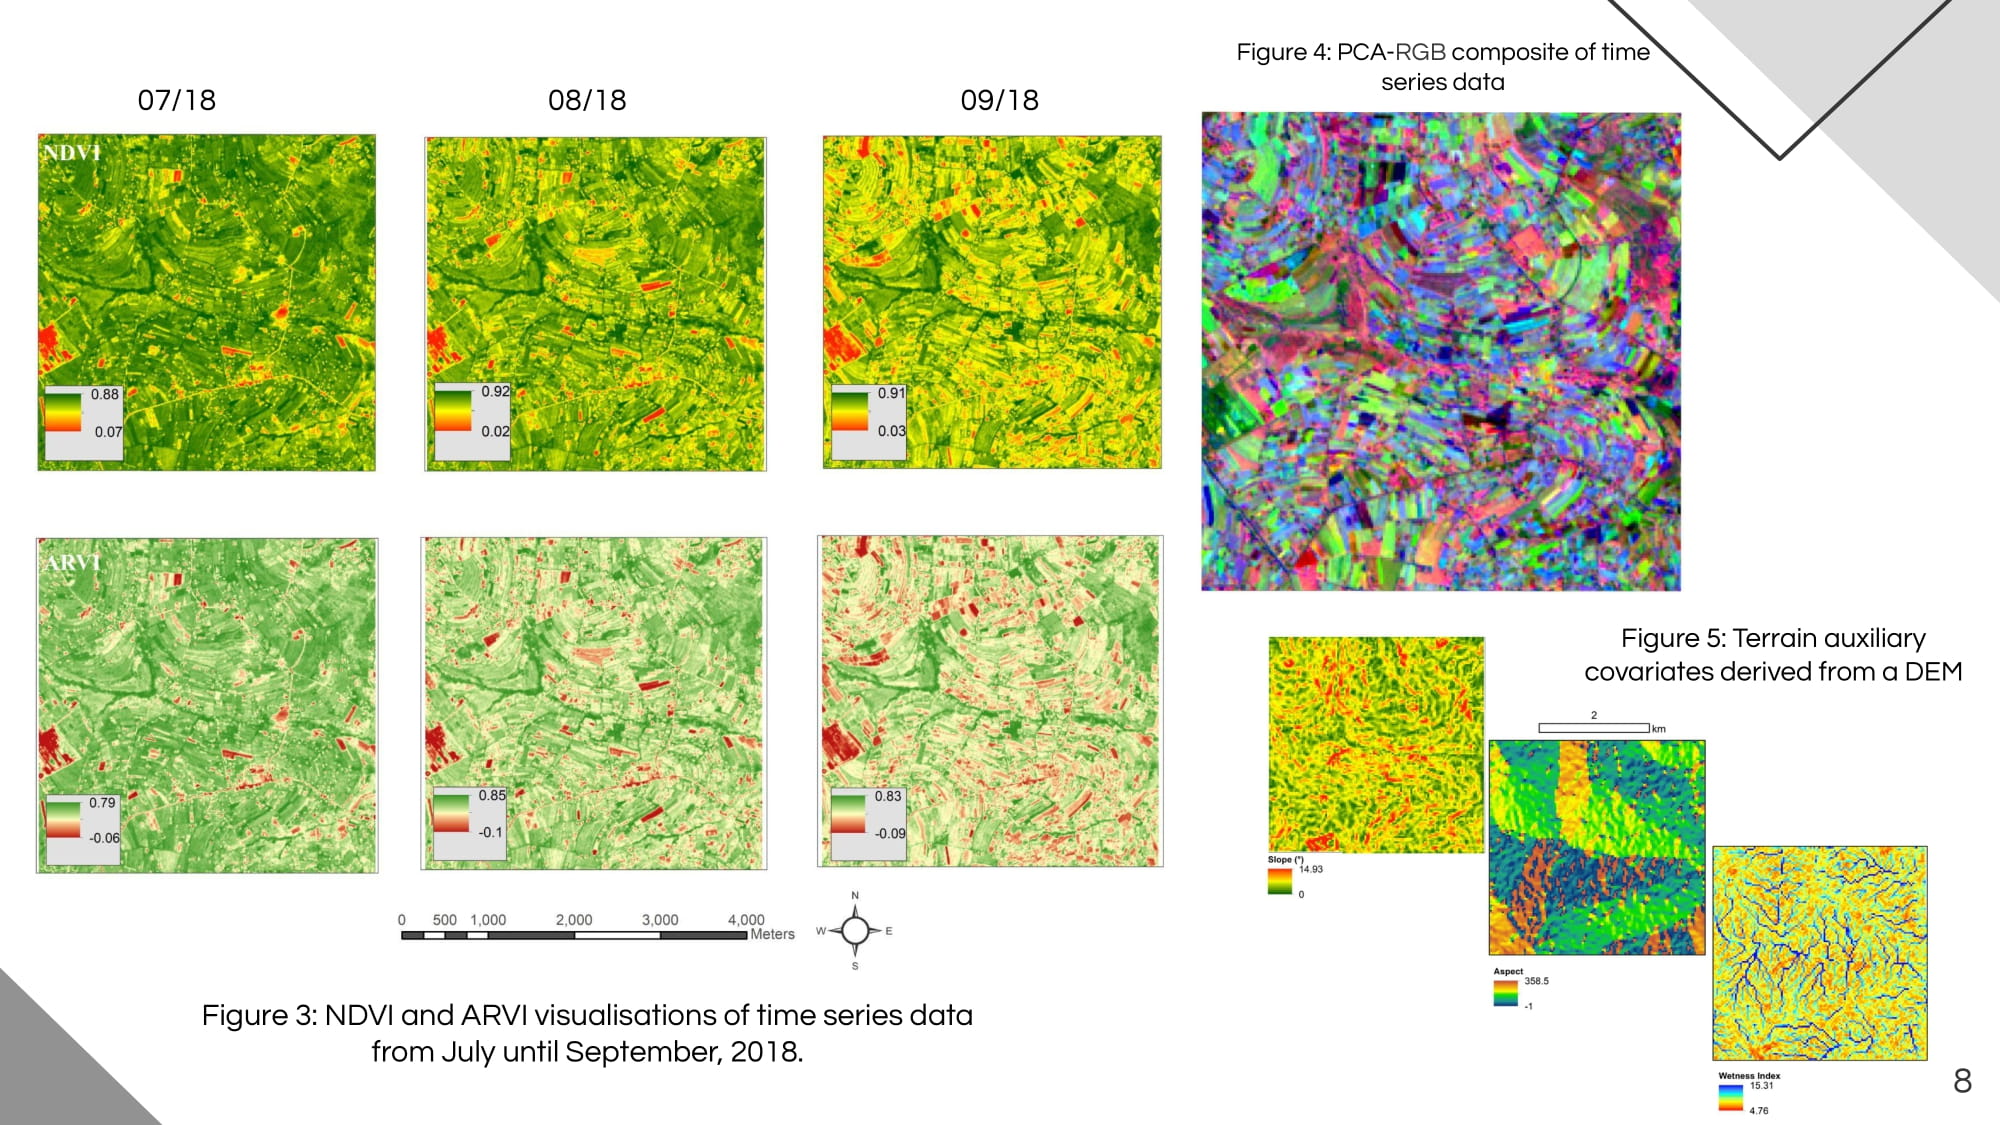
Additionally, we downloaded an SRTM elevation model in GeoTIFF format from the OpenTopography facility provided by the National Science Foundation. After subsetting and resampling the digital elevation model (DEM) via ArcMap 10.3, we computed the aspect, the slope, and the wetness index to investigate the influence of topography on crops productivity in a hilly landscape such as the study area.

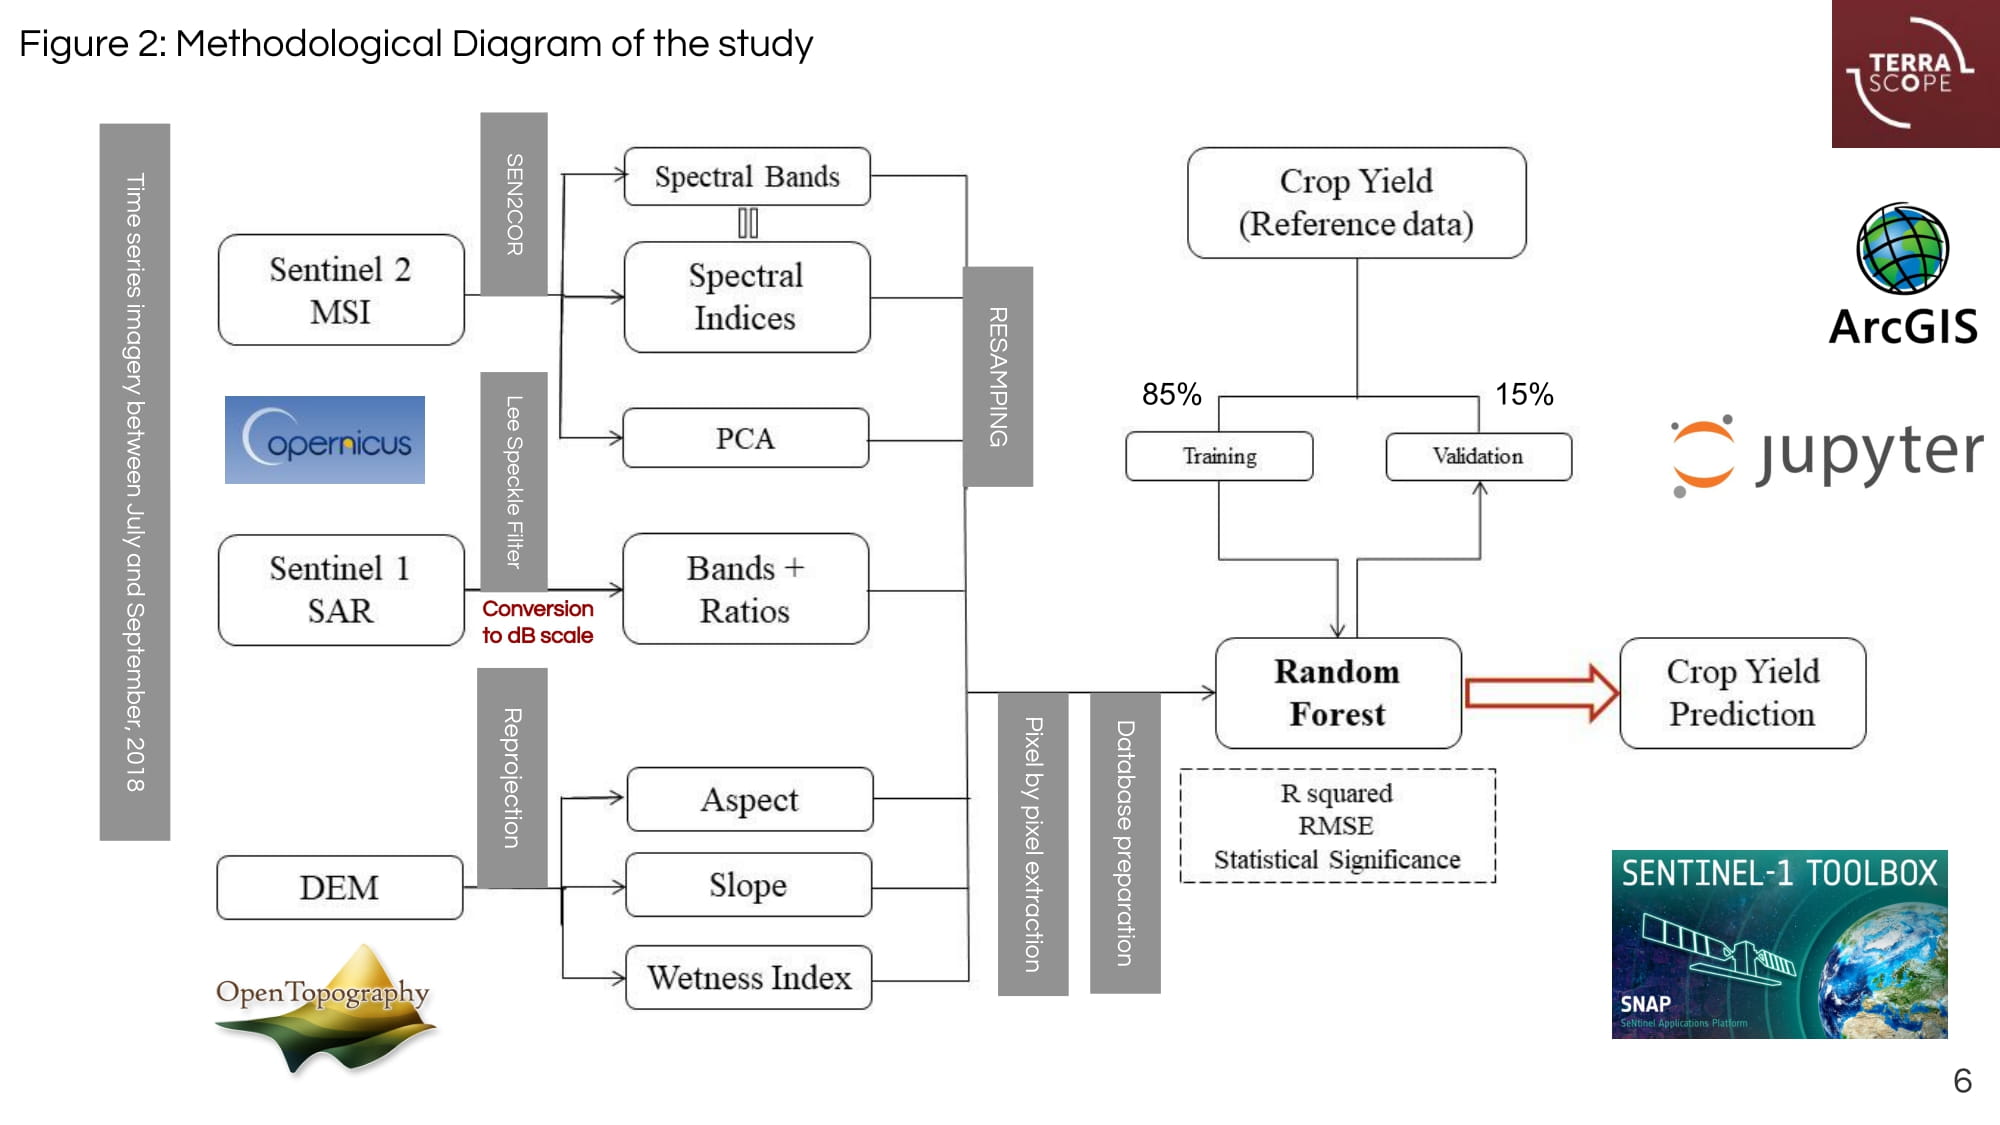
by Ghada Sabheni
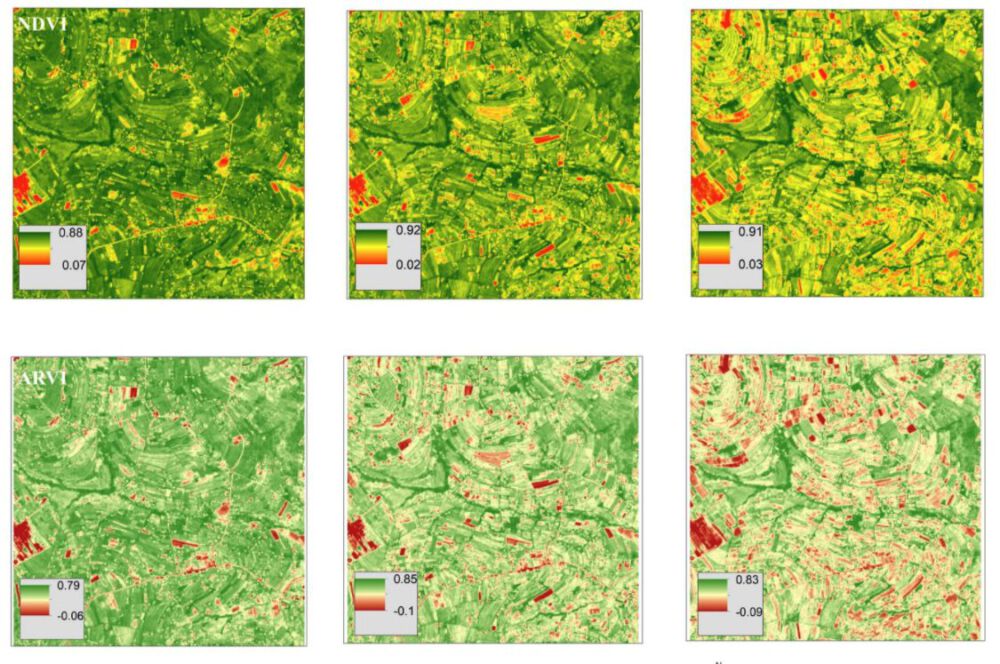
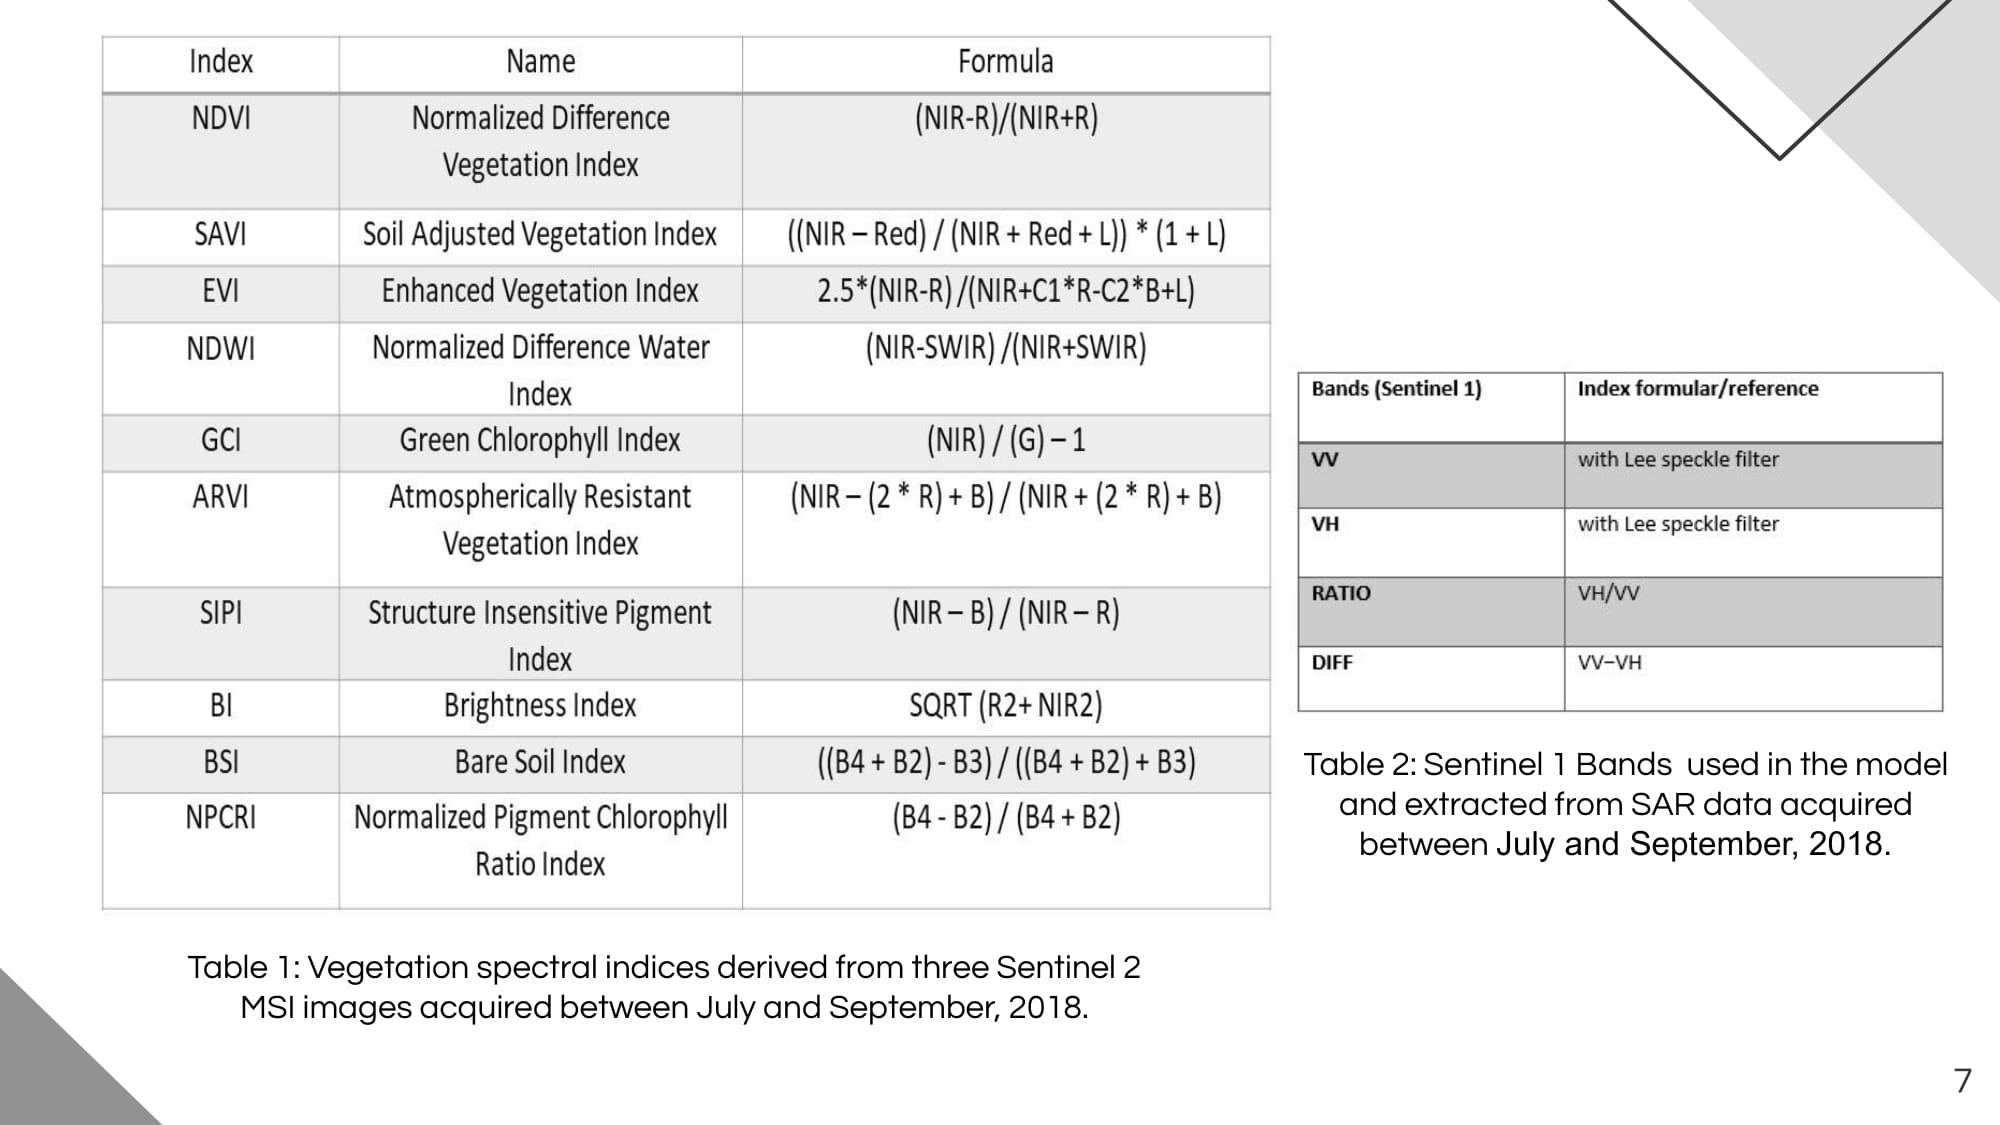
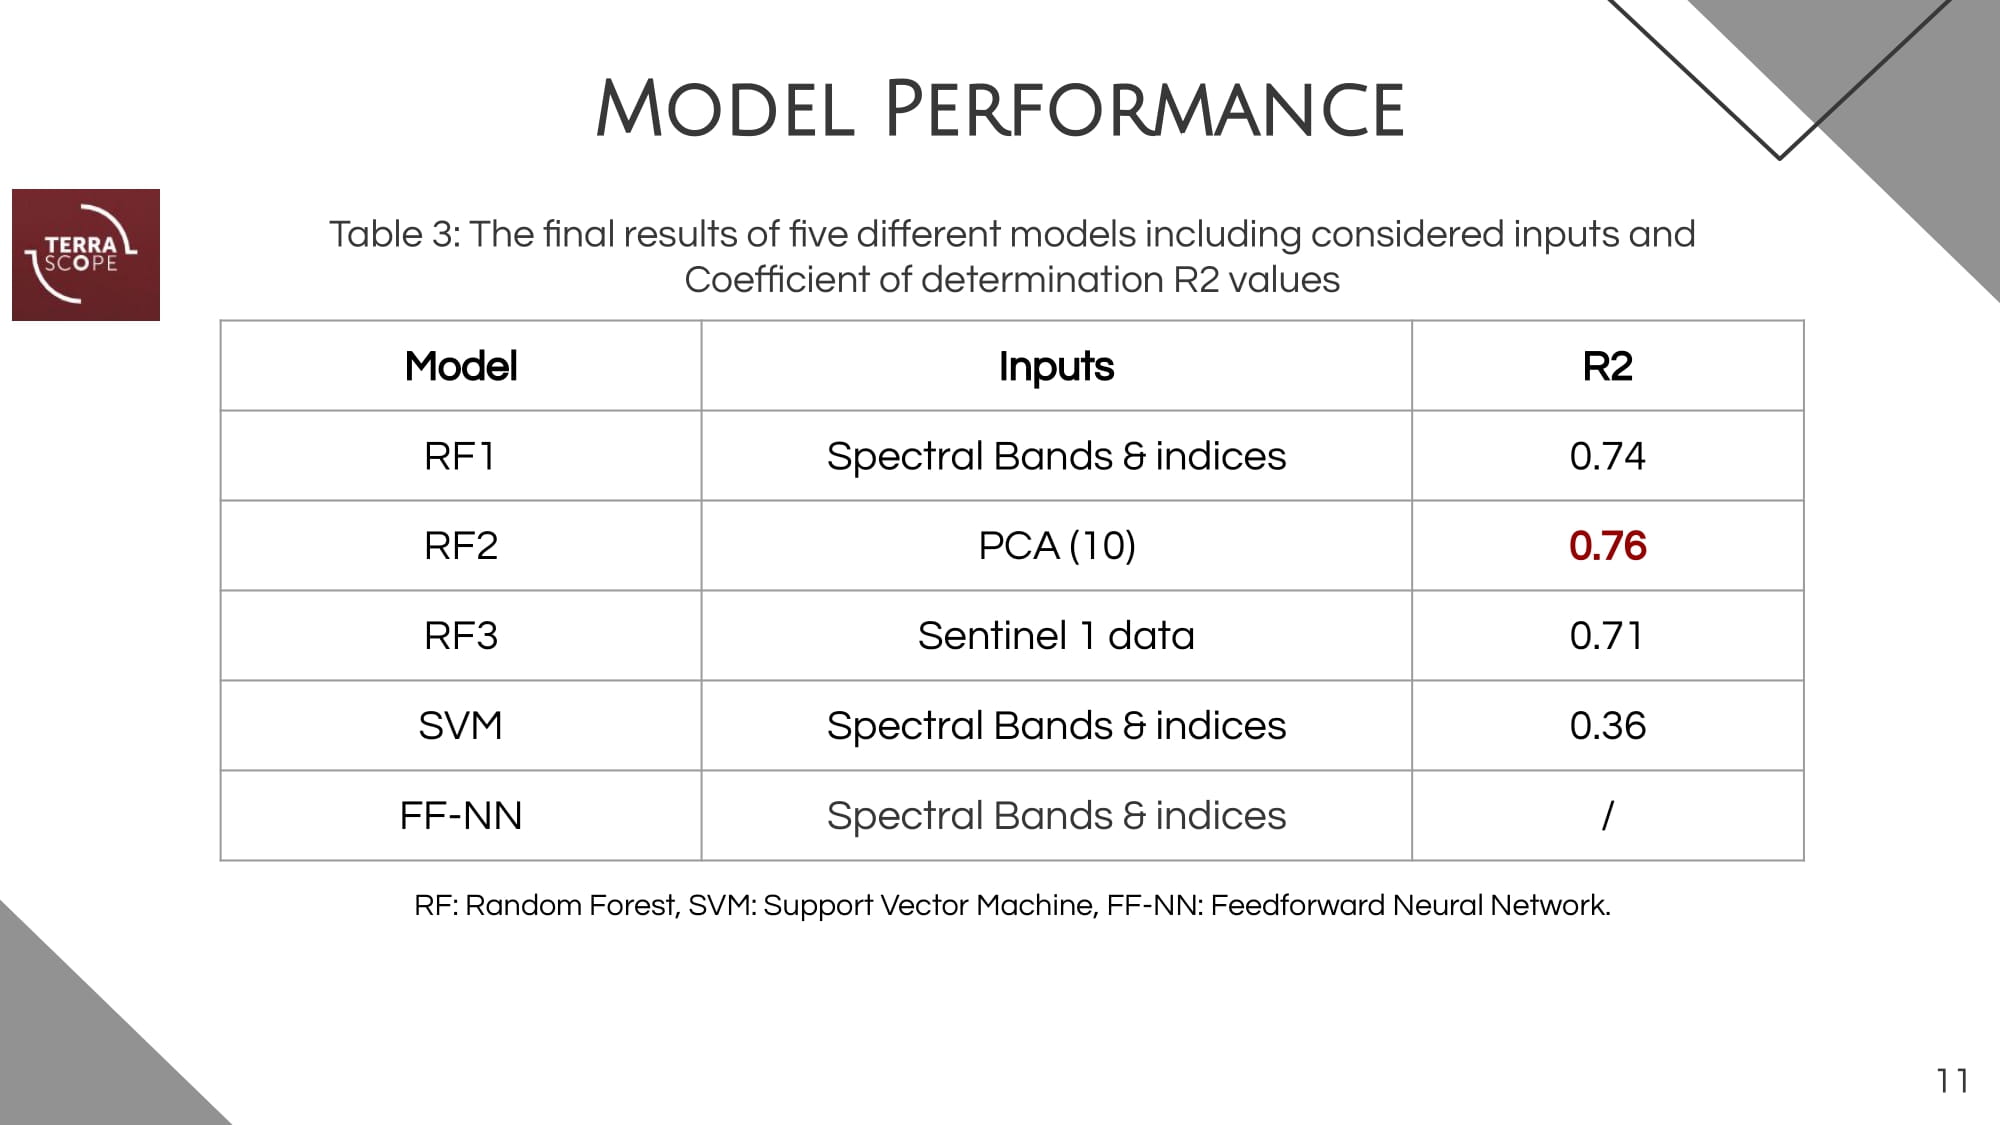
Three Sentinel-2 top-of-atmosphere reflectances (L1C), acquired between July and September 2018, were downloaded from Copernicus Open Access Hub (https://scihub.copernicus.eu/) and atmospherically corrected using the Sentinel-2 atmospheric Correction (Sen2Cor processor) toolbox to obtain corrected surface reflectance (SR) for all bands excluding B1 and B10 (cirrus bands). World Geodetic System (WGS-1984) datum and Universal Transverse Mercator (UTM) projection system with Zone 37 S were used for all geographic datasets to match them geometrically. Then, ten spectral vegetation indices and Principal Component Analysis (PCA) were computed from Sentinel-2 MSI data. We used SNAP 8.0.0 to process Sentinel-2 MSI data and calculate vegetation spectral indices. The statistical significance and features importance were tested before implementing the model to exclude irrelevant and multi-collinear parameters. However, time-series of multispectral, SAR features and terrain auxiliary variables with the highest determination coefficient R2 with crop yield were used to train the random forest (RF) model for maize yield prediction. The RF model was calibrated for SAR- only, PCA- only, and optical-SAR integration scenarios.

by Simon Donike
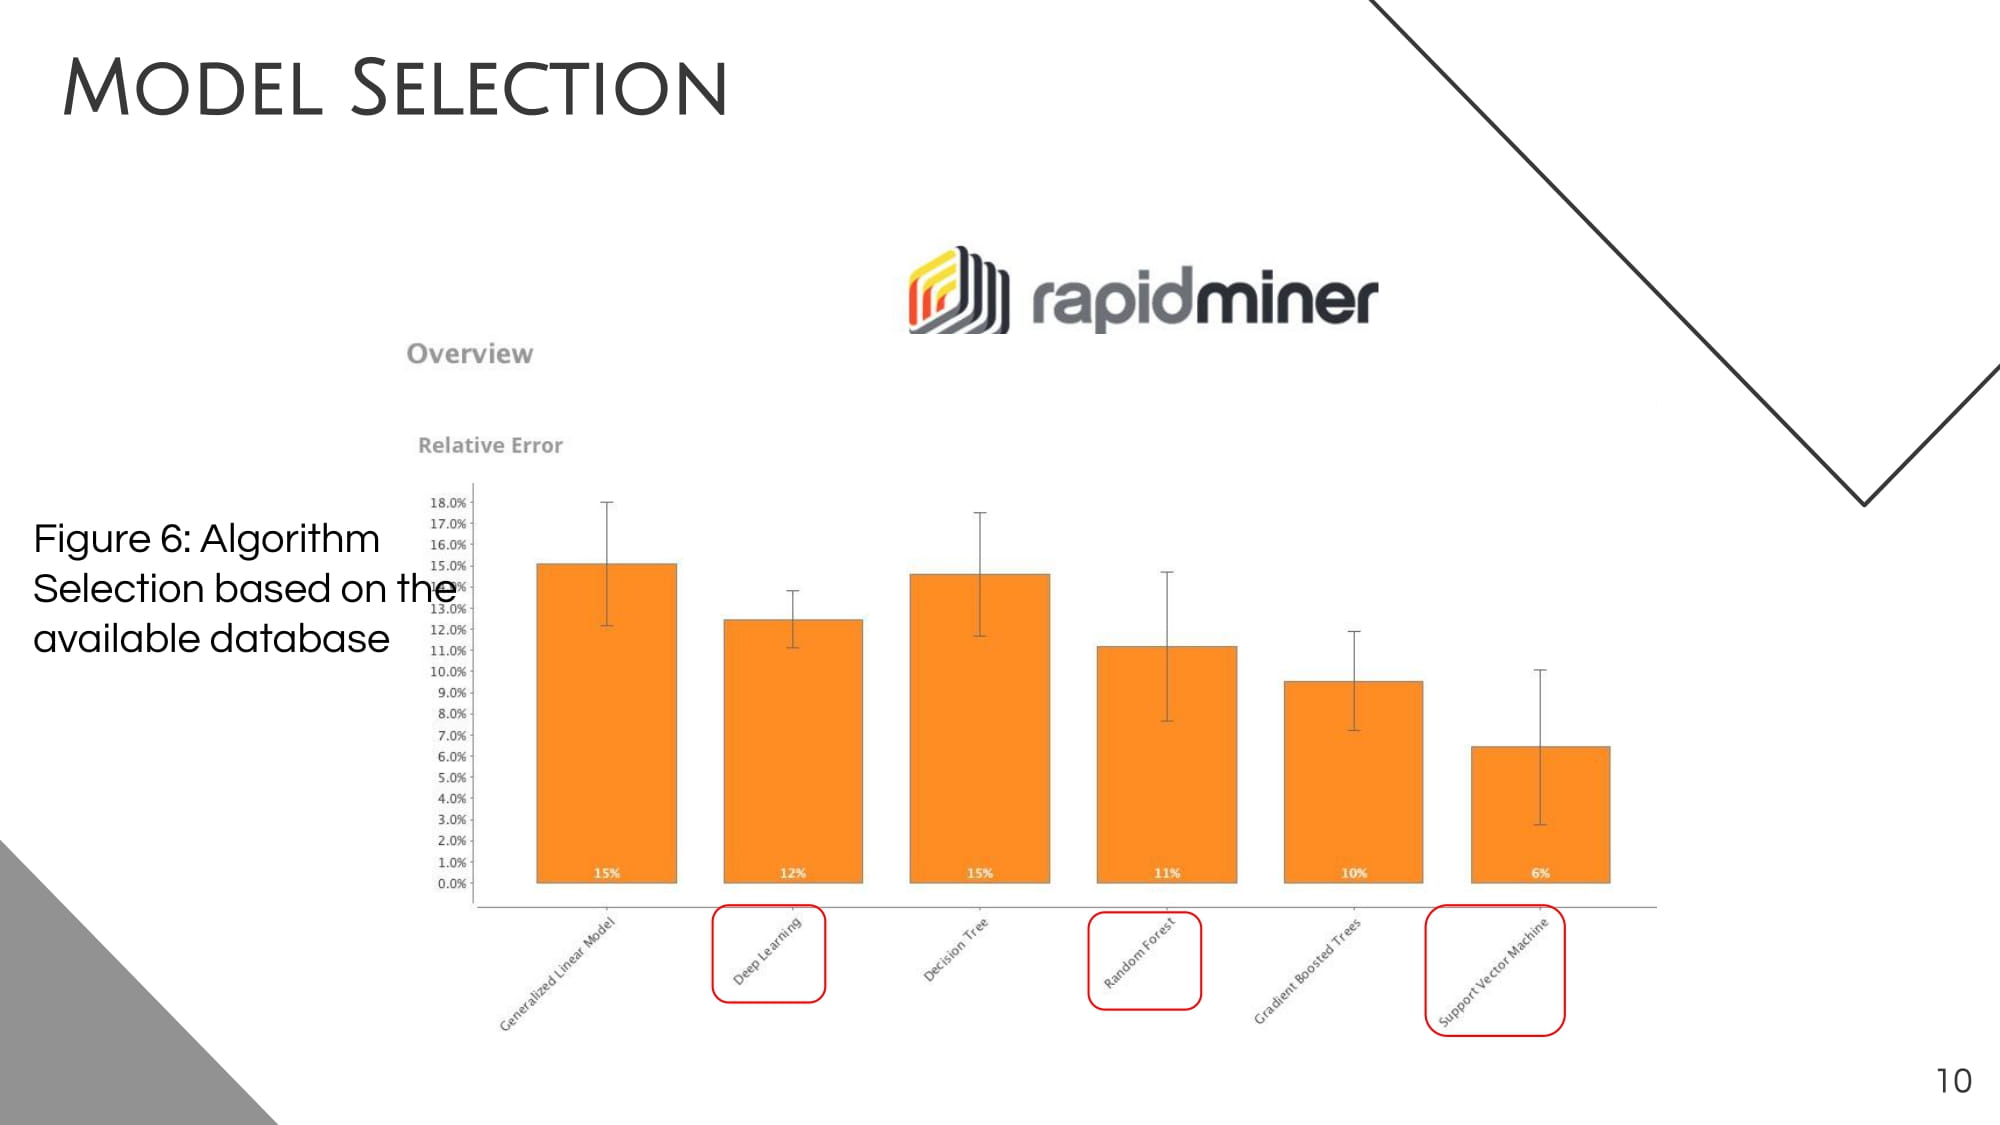
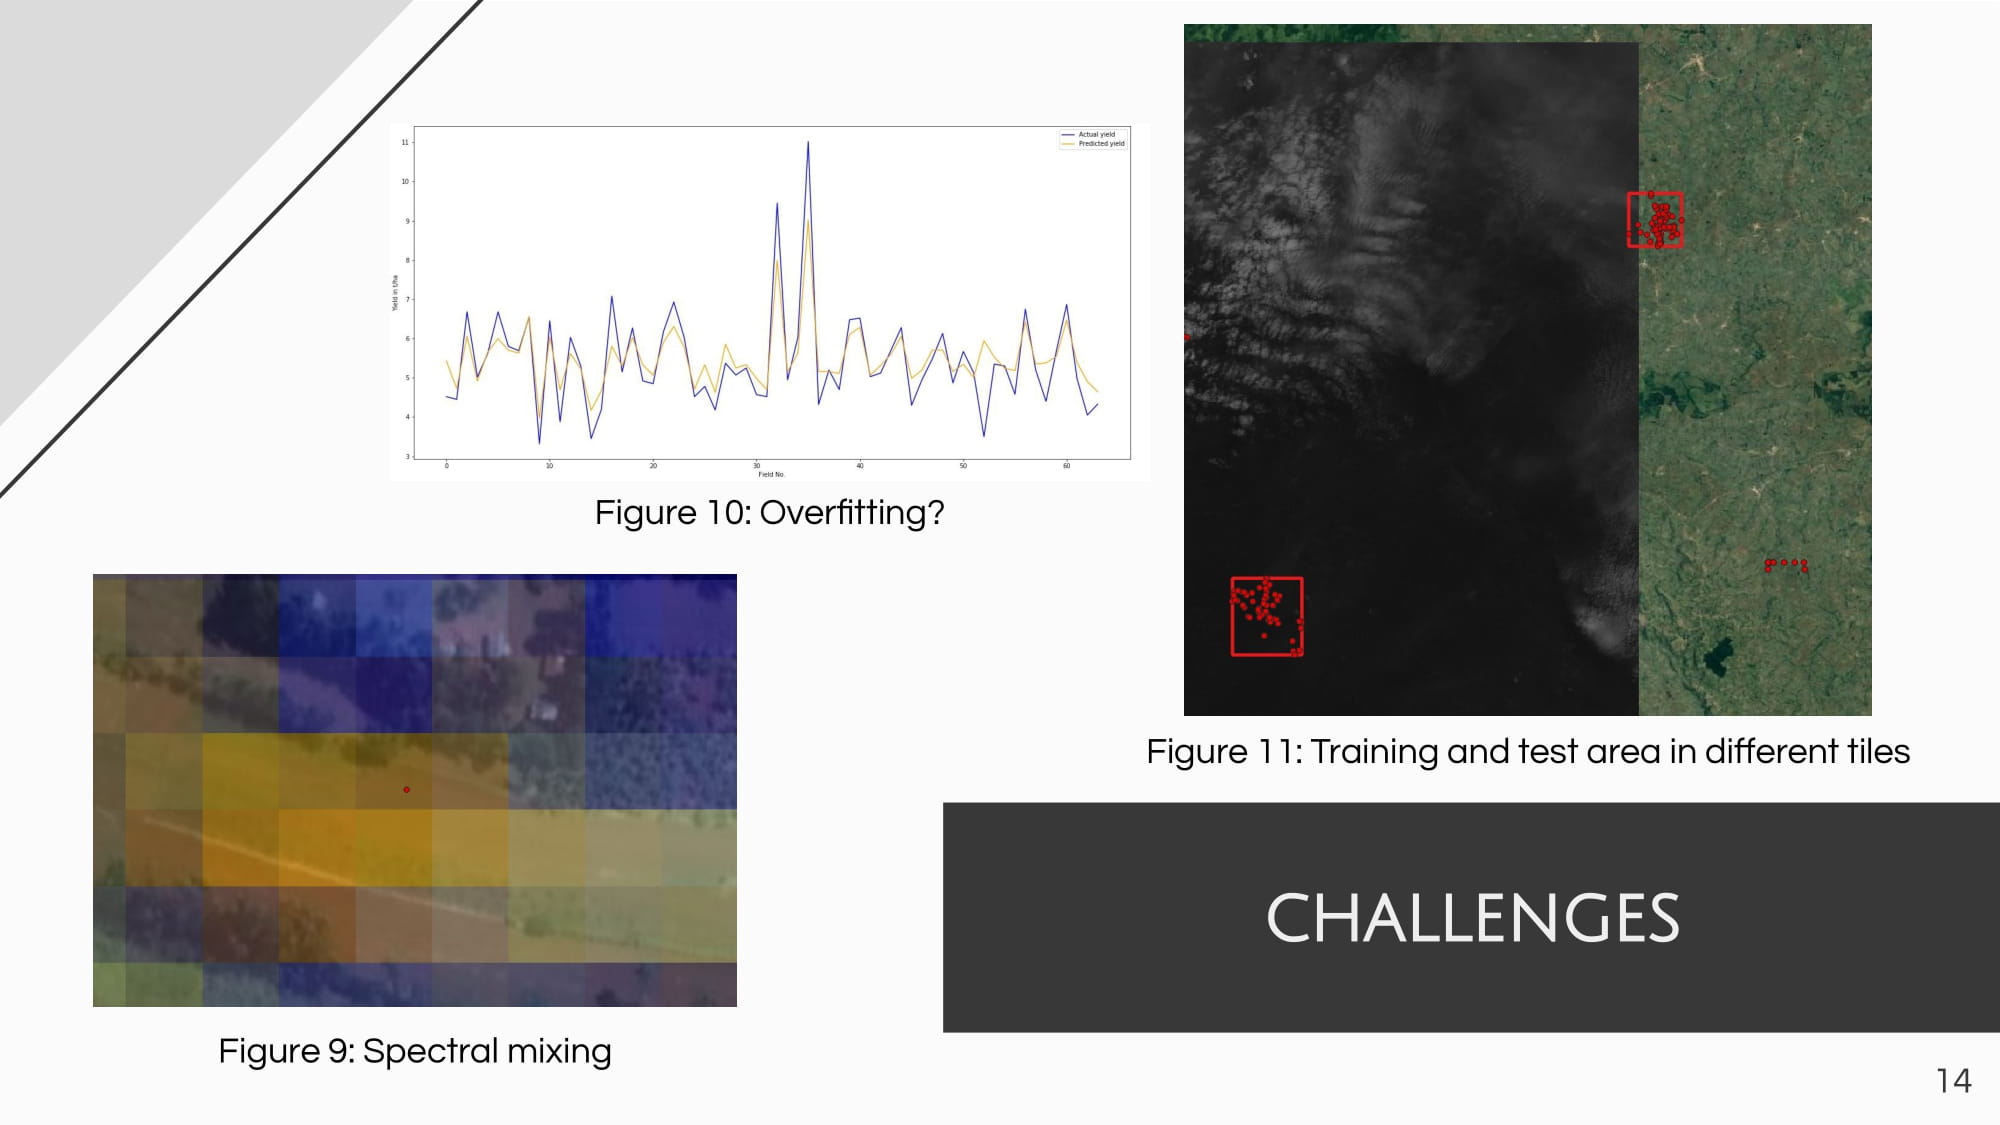
Multiple iterations of the random forest model, with different input features and internal structures, are produced and analyzed. However, we computed the coefficient of determination R2 for each regression model to assess its statistical performance and select the best fit. The used algorithm, feature inputs, and the corresponding R2 value are shown in Table 1. It is observed that the random forest regression model outperformed other ML models. Thus, combining time-series spectral bands and vegetation indices derived from Sentinel 2 data has a high coefficient of determination R2 value; although the PCA feature is high, the former is preferred for subsequent studies.
For all variations of the random forest, the same architecture is used based on extensive trial-and-error tests where varying settings for estimator number, tree depth, and the minimal number of inputs per node were tried out. A thousand estimators are created for the final model, leading to a random forest consisting of 1000 individual decision trees per model. While it was extensively tried to set a minimum number of samples that arrive at a node to allow the node to continue separating, it does not improve the overall model accuracy. The maximum depth was limited to 100, which is relatively high but keeping in mind the high number of input features, the decision trees need to take a wide variety of features into account and compare them. This setting is highly contested since a deeper decision tree might lead to overfitting, but having a shallower tree is less powerful and might not profit from all input features of the data set.
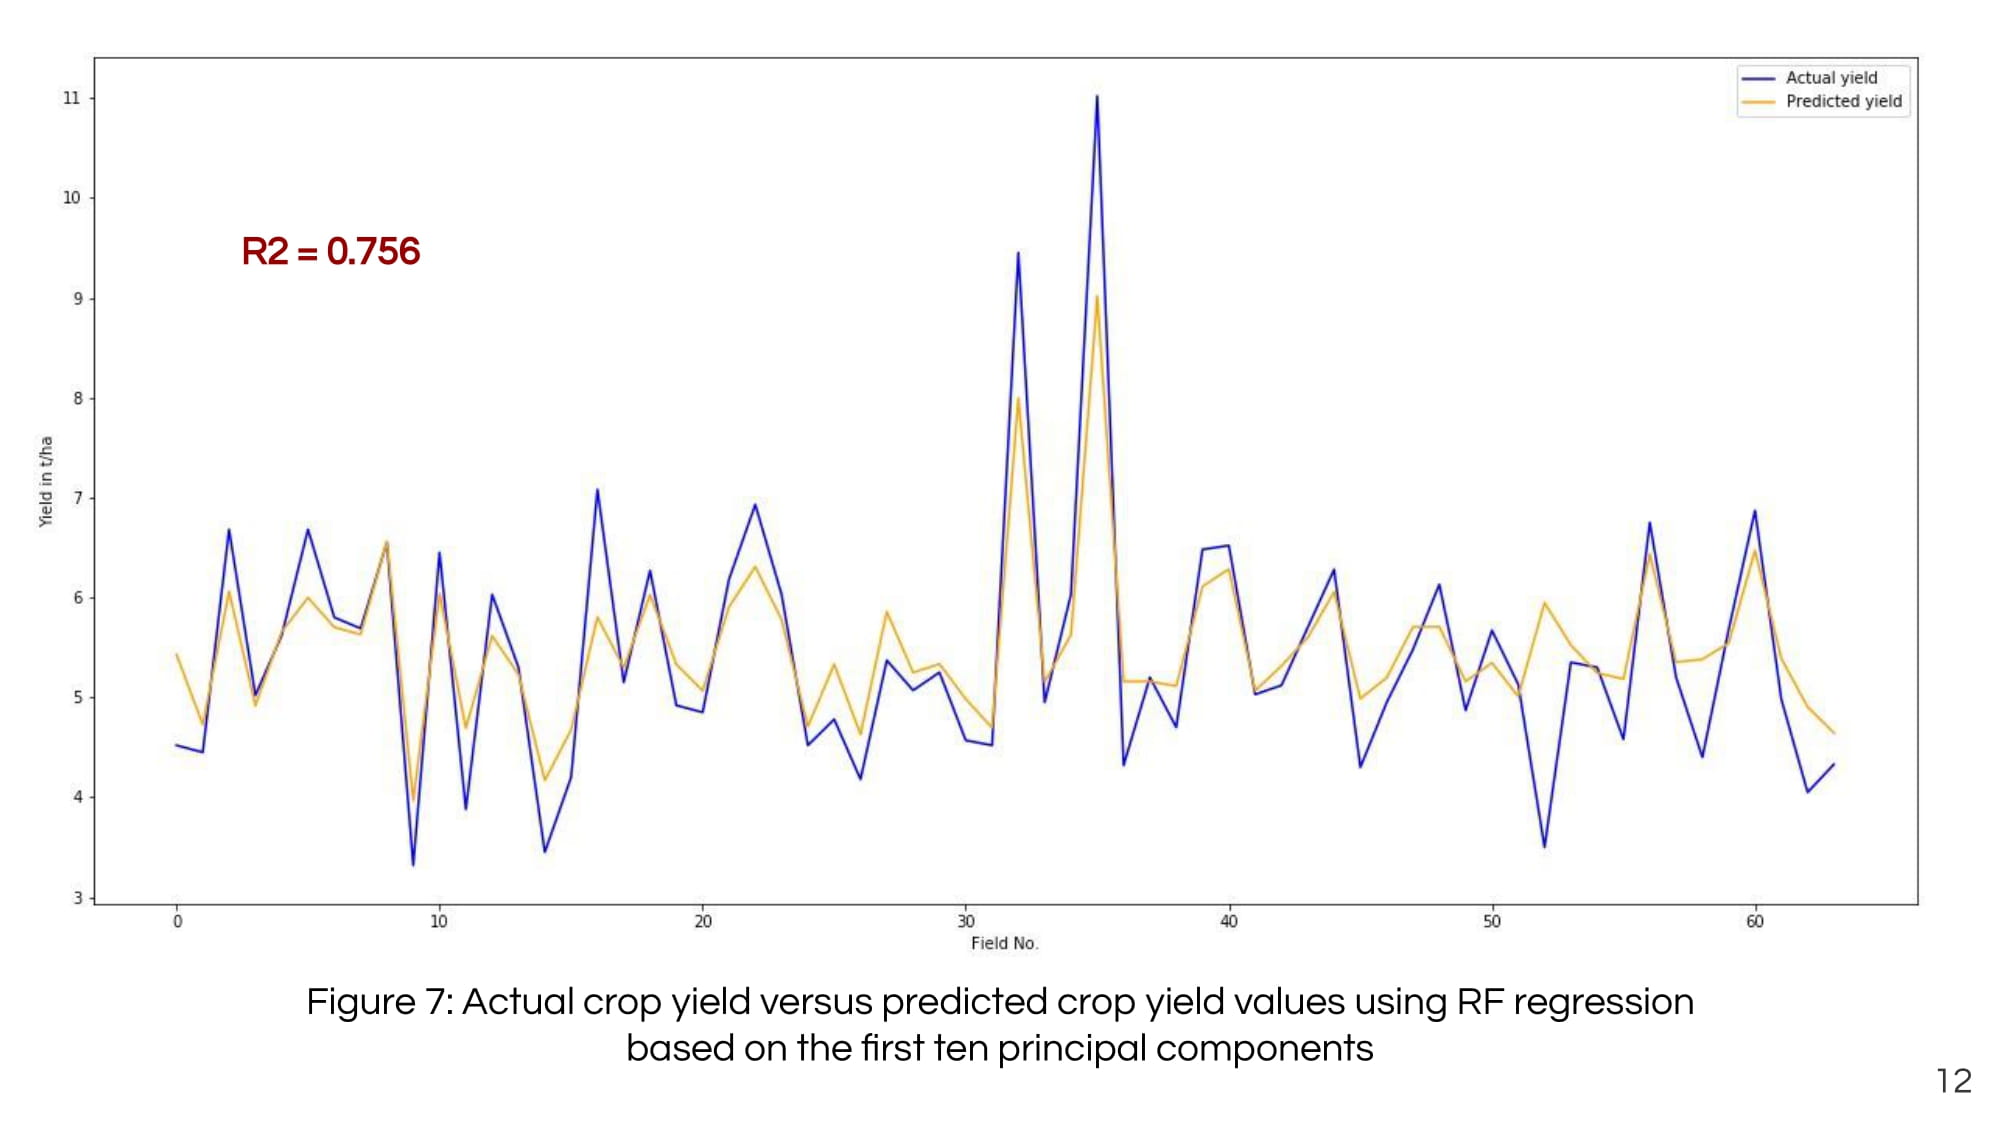
by Simon DonikeIncluding all input features in the model, a coefficient of determination R2 of 0.744 was produced, with the three most important features are:
- Red- Sentinel 2 (Acquired in August) – 7.2%
- Wetness index – 6.5%
- NIR – Sentinel 2 (Acquired in August) – 5.5%
by Simon Donike
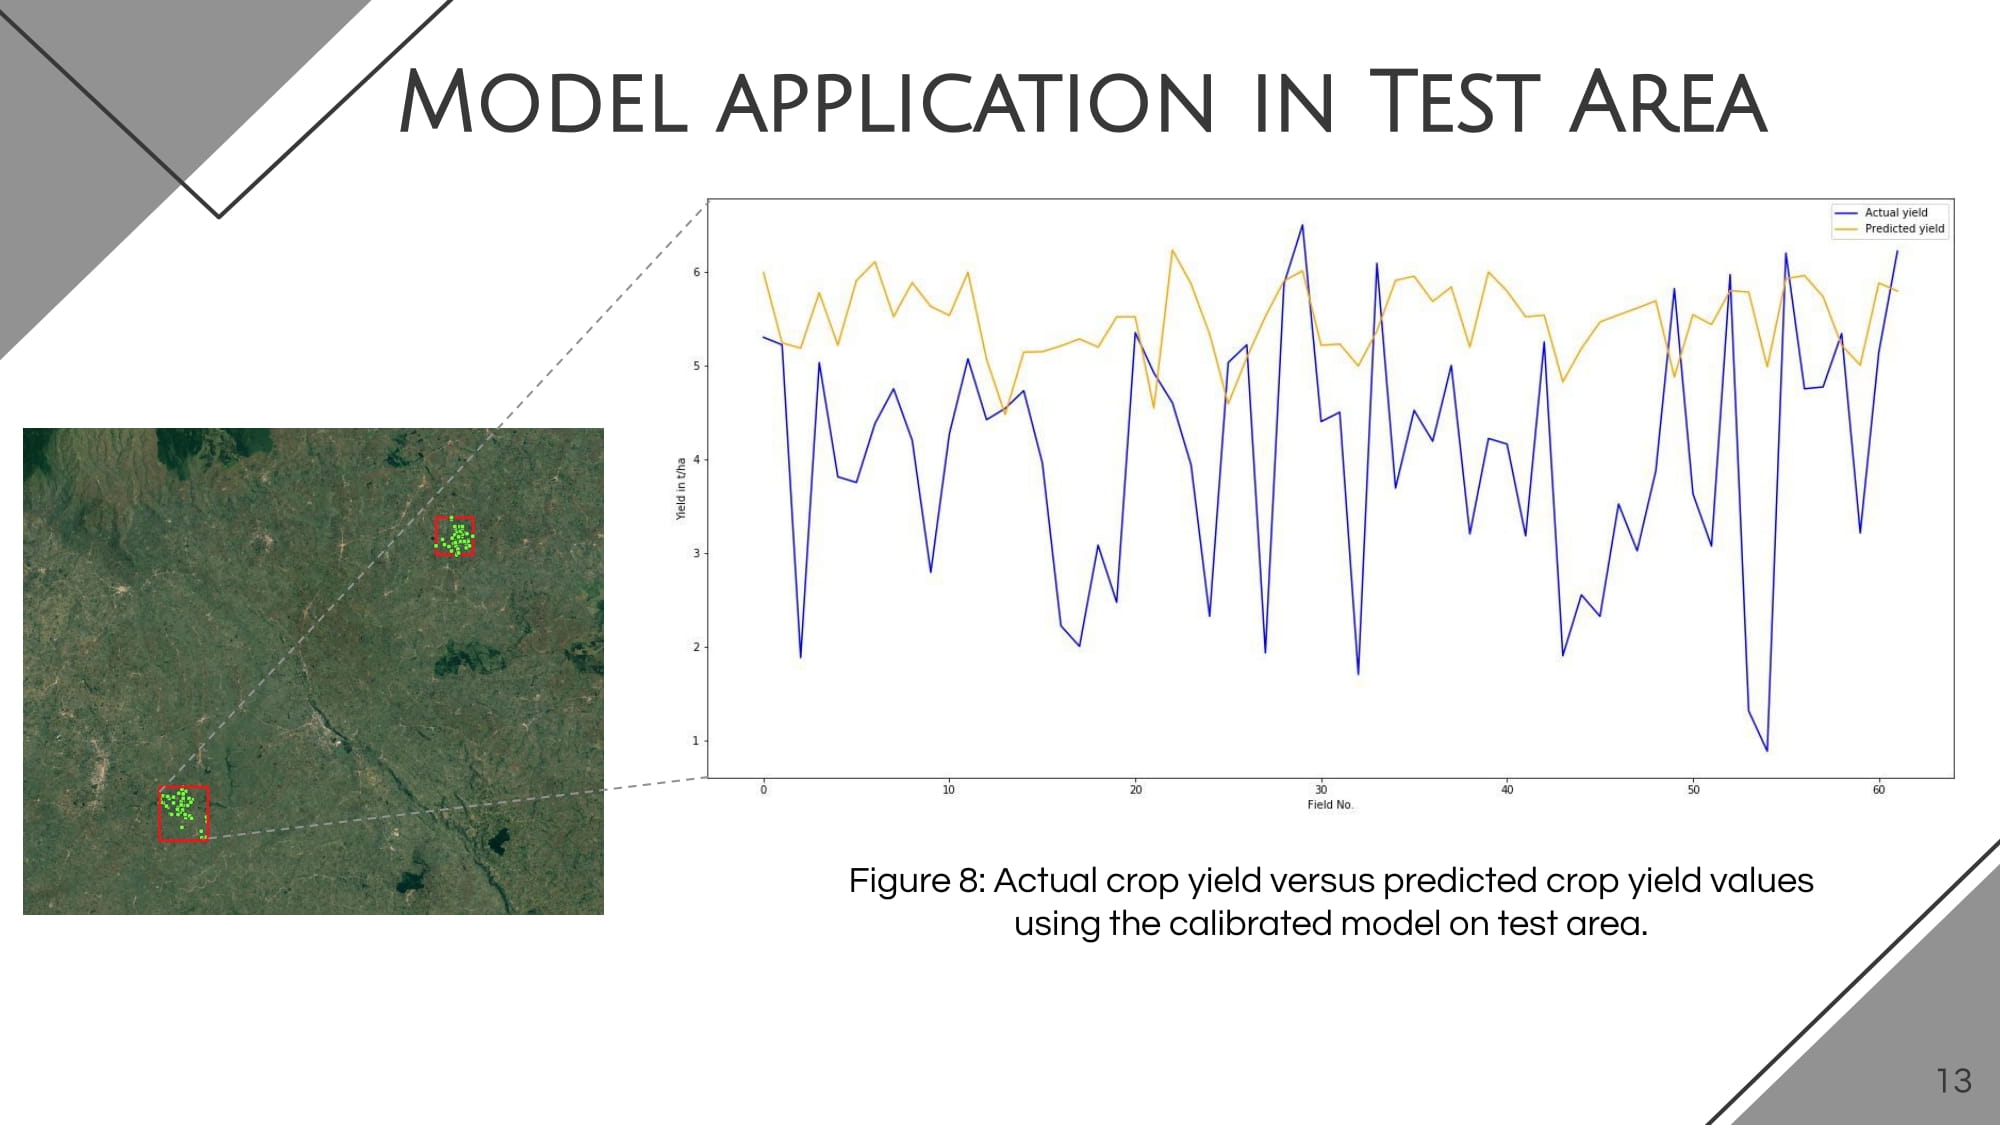
The approach based on random forest showed its superiority when compared with other used ML techniques. Thus, the final model succeeded in explaining 76 % of the data variance. Despite the instability of the model when applied to different agricultural areas, this study revealed the potential usefulness and efficiency of combining Sentinel-1 and Sentinel-2 data on predicting crop yield in Kenya. The trained model can be applied to other regions with similar conditions and characteristics; however, further investigation needs to be done to enhance the model’s accuracy and reduce potential data redundancy that caused slight overfitting of the model.


Conclusion and comments
Group Work
Having a lot of freedom in deciding the project for our group work was great. Being free in the choice of data and methods enabled us to work on a topic of our interest. But even though we were not limited in our choices for projects, the organized group sessions facilitated a lot of discussions, finding out the weaknesses and strengths for each group member. Based on that knowledge, with continuous feedback from the instructors, we could find a suiting project.
The project work itself was great to practice the coordination within a group. In my past projects I was usually by myself and therefore free in my time planning and way of accomplishing tasks. As the projects get more complicated, group work gets more and more important so I was happy to practice how to divide tasks, create a common time frame and work towards a goal in coordination.
Still, even while trying our best, the timeframe for this project was quite short. We could not completely reach all goals and not verify the results to a satisfactory degree. Additionally, using the terrascope platform and access the data via their platform was not very easy. In the given timeframe, it was not possible to implement the necessary code to use the platform. The time necessary to understand the platform and get the required result was just not there unfortunately.
Structure and Online Format
Since online classes, meetings and conferences have been the norm for close to two years now, the format itself is well known and there are no makor problems. The same problems always remain though, which are the lower interaction rates between lecturers and participants as well as between the participants themselves. Within those limitations, the organizers did a good job of fascilitating discussion and participation.
The structure of the courses gave a clear overview over all projects, the order of the courses made sense in a way that comprehension of more difficult concepts was built over time.
Proof of Attendance