Table of Contents
1. Introduction
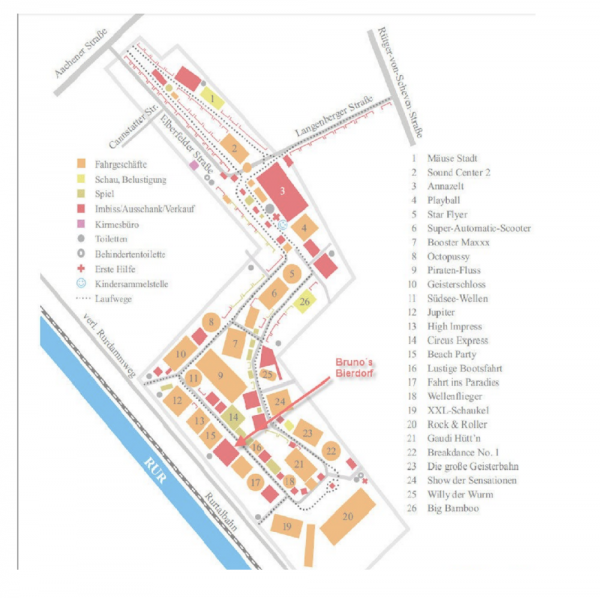
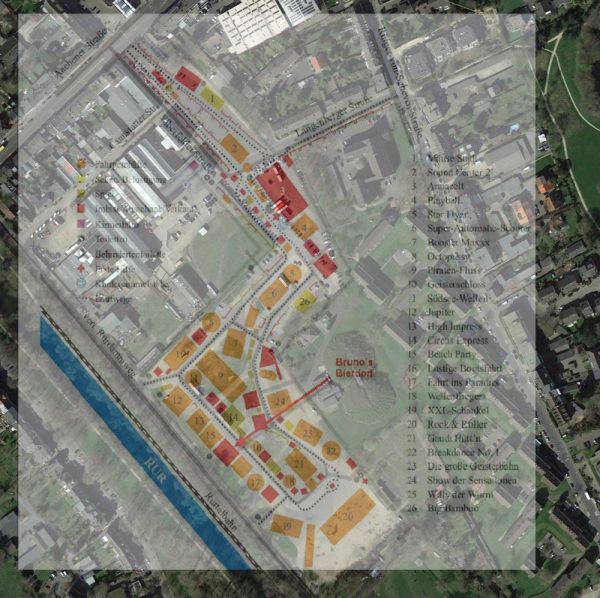
In the End of Term Assignment for the Spatial Databases course, a PostGIS backend as well as a routing functionality for a fun fair is implemented. My solution is based on the Annakirmes, held yearly in Düren, Germany and visited by almost 1 million guests anually.

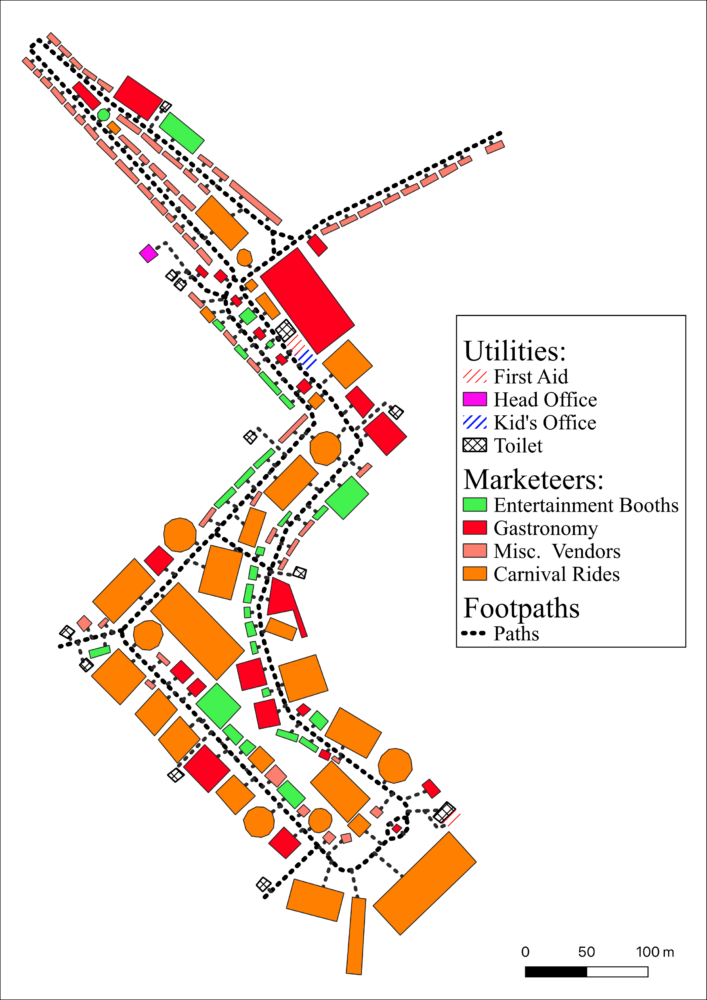
Based on the Annakirmes and its layout, a routing functionality is implemented. The user (or potentially an app) inputs his or her location via coordinates and is routed along the footpaths across the carnival grounds to the closest service of his or her choosing. The target categories include gastronomy booths, carnival rides, vendors, entertainment booths, the First Aid Station, the Kid’s Office, the Organizers Office as well as Restrooms. The navigation is then visualized via an image of the carnival grounds, where the route is highlighted to guide the user.
This article is structured by the steps performed, with a demonstration of the functionality at the end.
The code can be found on GitHub.
2. Georeferencing of input data
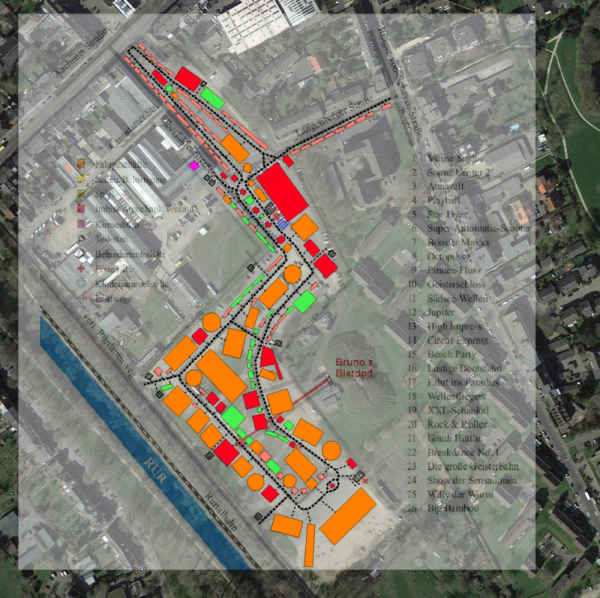
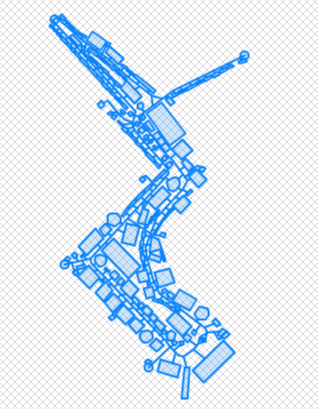
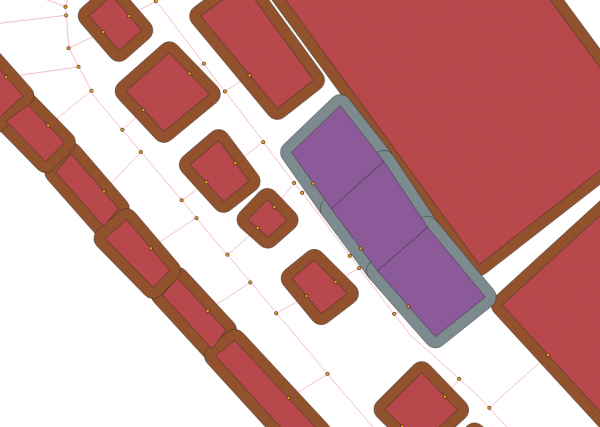
All features were traced using snapped polygons and lines, which is important because the edges of the objects need to be exactly on the same coordinate in order to build the topology for pgrouting.
3 Layers/Shapefiles were created:
- Marketeers: Containing polygons representing rides, entertainment booths, gastronomy, and other vendors of different products.
- Utilities: The utilities provided by the organizers include two First Aid stations, a head office, a kid’s office to find kids that have gone missing as well as the bathrooms.
- Footpaths: Represents the ways that visitors can move around the grounds as well as paths connecting each booth/location with the network in order to be able to perform routing.
3. Importing Features to PostGIS
Now that the shapefiles are created, they need to be imported into PostGIS. Since I have PostgreSQL as well as PostGIS running on a Ubuntu server, the ogr2ogr functionalities were sued to import the shapefiles into the table structure and create the geometries. The following command takes care of that:
ogr2ogr -f PostgreSQL PG:dbname=annakirmes 'utilities.shp'
ogr2ogr -f PostgreSQL PG:dbname=annakirmes 'marketeers.shp'
ogr2ogr -f PostgreSQL PG:dbname=annakirmes 'footpaths.shp'
It is important to note that the geometries are in the WGS84/Pseudo-Mercator (EPSG:3857) projection, therefore when giving GPS WGS84 (EPSG:4326) coordinates later, reprojections have to be performed.
In order to check if all the geometries are created accordingly, the ‘geom’ columns are visualized.
4. PG Routing Installation
Next up, in order to get the routing going, pgrouting needs to be installed on the server. The statements below are explained in the official tutorial.
sudo apt install postgresql-10-pgrouting

sudo sh -c 'echo "deb http://apt.postgresql.org/pub/repos/apt/ $(lsb_release -cs)-pgdg main" > /etc/apt/sources.list.d/pgdg.list'

sudo apt install wget ca-certificates

wget --quiet -O - https://www.postgresql.org/media/keys/ACCC4CF8.asc | sudo apt-key add -

sudo apt update

sudo apt install postgresql-9.5-pgrouting

sudo apt-get update & sudo apt-get upgrade
After the installation on the system, the extension needs to be activated from within the database.
CREATE EXTENSION pgRouting; 5. Preparation of Spatial Data for Routing
The data needs to be both converted to a routable form and made searchable for start- and endpoints, where the carnival booth information can be queried for their node IDs.
5.1 Creating a routable network
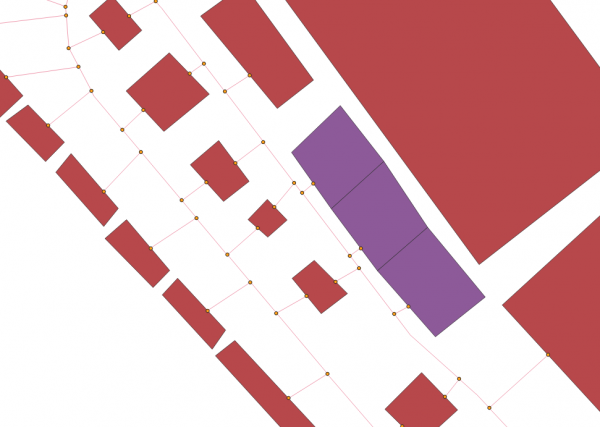
SELECT pgr_nodeNetwork('footpaths', 0.001, 'geom'); 
Based on the noded table, we can now create the topology of the routable layer. The statement below returns the ‘footpaths_noded_vertices_pgr’ table, which contains the line segments of the routable layer as well as the start and end node IDs of each segment.
SELECT pgr_createTopology('footpaths', 0.0001, 'geom', 'id'); 
5.2 Analyzing and verifying routable network
In order to verify the topology, the pgr_analyzeGraph function is called. This analyzes the graph for isolated segments, dead ends and intersections. Inspecting the messages produced can give an impression on weather the creation of a routable network has worked or not. In this case, the high number of dead-ends is expected since the footpaths end at the boths.
HINWEIS:  PROCESSING:
HINWEIS:  pgr_analyzeGraph('footpaths_noded',5,'geom','id','source','target','true')
HINWEIS:  Performing checks, please wait ...
HINWEIS:  Analyzing for dead ends. Please wait...
HINWEIS:  Analyzing for gaps. Please wait...
HINWEIS:  Analyzing for isolated edges. Please wait...
HINWEIS:  Analyzing for ring geometries. Please wait...
HINWEIS:  Analyzing for intersections. Please wait...
HINWEIS:              ANALYSIS RESULTS FOR SELECTED EDGES:
HINWEIS:                    Isolated segments: 0
HINWEIS:                            Dead ends: 184
HINWEIS:  Potential gaps found near dead ends: 5
HINWEIS:               Intersections detected: 5
HINWEIS:                      Ring geometries: 0

Successfully run. Total query runtime: 363 msec.
1 rows affected.
Now, the routing can start. Using Dijkstra’s pathfinding algorithm, we can create a route between a start- and an endnode. The pgrouting implementation takes the SQL query on the network, therefore an on the fly created table, and the start- and endnode.
Note:
- pgr_dijkstra() requires the column containing the IDs to be named ‘id’, while ogr2ogr automatically creates the ID column as ‘ogc_fid’.
- prg_dijkstra needs a column representing the cost of each segment. This is intended to distinguish between e.g. highways and rural roads, therefore allowing the navigation to take quicker roads into account. In this example, the column does not matter so a ‘cost’ column was created with the value ‘1’ for each row.
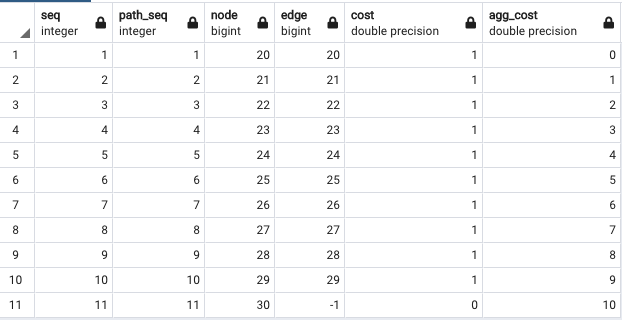
SELECT pgr_dijkstra('SELECT * FROM footpaths', 20, 30); The pathfinding algorithm returns a table that contains the sequence of navigation along the line segments. The table includes the sequence ID and path sequence (both inceremental from 1), node and line IDs as well as the cost of this segment and the aggregated cost of all segments so far.

Currently, there are still issues with the routable network layer. For some locations, the algorithm can not turn at nodes and for certain destination the routing therefore fails. The visualizations and demonstrations are created with selected source and target nodes where the routing works out.
5.3 Preparing Data to connect node IDs with booth information
With the routable network and pathfinding algorithm set up, it is possible to navigate from one node to another. But since only the numerical node IDs are available, it is not known which node ID represents a certain booth, such as a carnival ride.
The vertices layer contains the node points, therefore it is possible to sample each point location and join the attribute table of the node with the underlying polygon of a certain booth. The ‘Point Sampling Tool’ accomplishes that, saving the result to the ‘vertices_sampled’ shapefile and importing this file into the database as a table.
The resulting table can now be queried for polygons of a certain type, for example gastronomy. Since the information comes from two layers and different columns within the attribute tables of these layers, the resulting ‘vertices_sampled’ table has the relevant information in split columns too. Therefore, we just query both of these columns and search for “gastronomy” objects.
SELECT ver_id, wkb_geometry FROM vertices_sampled WHERE ut_type = 'gastronomy' OR mar_bus= 'gastronomy'; 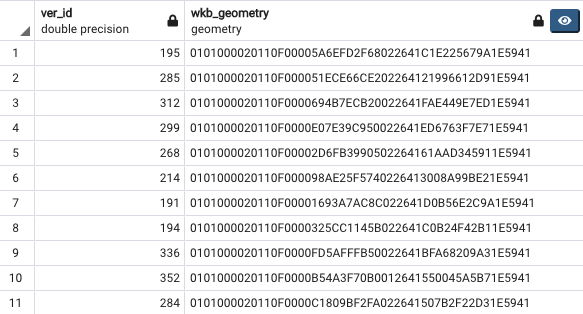
After the preceding steps, a routable network was created as well as a table that allows querying of node IDs by the properties of the polygon that they represent. The data is now set up correctly and a focus can be put on the implementation of the other functionalities.
5.4 Creating User and granting Rights for Python Connector
GRANT SELECT
ON footpaths_noded, vertices_sampled
TO bot_annakirmes;
6. Implementation of SQL Commands
With the data and database structure in place, let’s take a step back and look at the functionality that should be implemented. The user gives his location and a type of destination, the routing should then guide the user along the footpaths to the nearest booth of said type. Logically, the following steps need to be taken:
- The input coordinates need to be transformed/reprojected to the correct SRS
- The nearest network node to the user’s location needs to be identified to serve as start node
- The nearest booth of the selected type needs to be identified as well as it’s node, which will serve as endpoint of the routing
- The routing needs to be performed and visualized
The necessary SQL commands are now broken down one by one for one example, later on within the Python connector the statements will be automatically constructed based on the user’s inputs.
6.1 Getting nearest Network Node to User’s Location
The following statement combines several PostGIS commands. First of all, the ST_MakePoint() command takes coordinates as well as an EPSG Code and turns it into a geometry. Because the user shall input WGS84 4326 coordinates, the ST_Transform() function then reprojects the point to the 3857 projection used in the rest of the database. The ‘SELECT’ statement surrounding the point is used to query the nodes layer for their IDs, as well as the calculated distance from the node geometry point to the user’s coordinates (by using ST_Distance). The return is ordered ascending by the distance, the return is also limited in order to only produce the single closest point.
The statement therefore returns the closest node ID as well as the distance of said ID to the user’s location. The node ID is used as the starting point of the routing.
SELECT id,
  ST_Distance(
    the_geom,
    ST_Transform(
      ST_SetSRID(
        ST_MakePoint(6.480086,50.793060),4326),3857)) AS dist
FROM footpaths_noded_vertices_pgr
ORDER BY dist LIMIT 1;
6.2 Identifying closest booth of certain type
In order to identify a certain type of booth, the vertices_sampled location is queried. The SQL statement is very similar to the statement above, with the difference that we only select those rows where the condition of the e.g. ‘gastronomy’ booth is met. Since the sampling of the nodes with the underlying polygons had its information in two different layers, the type was also stored in two different columns within the resulting layer. Therefore, both columns are queried. Since there classification of booths do not share common keywords from the utilities and marketeers table, this does not pose an issue.
Again, one node ID is returned.
The returning node ID serves as endpoint for the routing.
SELECT ver_id,
    ST_Distance(wkb_geometry,ST_Transform(
        ST_SetSRID(ST_MakePoint(
            6.480086,50.793060),4326),3857))
AS dist FROM vertices_sampled
WHERE ut_type = 'gastronomy' OR mar_bus= 'gastronomy'
ORDER BY dist LIMIT 1;
6.3 Performing the Routing
Since the start- and end nodes are now identified, the pathfinding algorithm can be started.
As stated before, the pathfinding algorithm at the center of this takes the routable layer as well as the node IDs as inputs. In this case, the routable network is given as a statement, therefore the routable table is created on the fly for this operation, selecting the length of each segment as cost. From the returning route table, all previously mentioned columns are selected.
Since the routing return only contains the segment IDs and not the geometries themselves, the routing table is joined with the routable network layer table based on the segment IDs, returning their geometries. Also, the returning segments are converted into the extended Well Known Text format, since the geopandas python library can read these geometries and plot them vie matplotlib.
SELECT seq, path_seq, node, edge, directions.cost ,
    agg_cost, ST_AsEWKT(ST_TRANSFORM(geom,4326)) as geom
FROM pgr_dijkstra('SELECT id,source,target ,st_length(geom) as cost FROM footpaths_noded'
,10,30)
as directions

JOIN footpaths_noded fn
ON directions.node = fn.id;
7. Connecting Python to DB, automatizing requests and return handling
In the previous segment, the basic SQL queries that need to be performed were outlined. Now, a python database connector is created, enabling the SQL statements to be generated based on the user’s information dynamically, sending those requests to the database and receiving the results, as well as produce a final visualization of the routing.
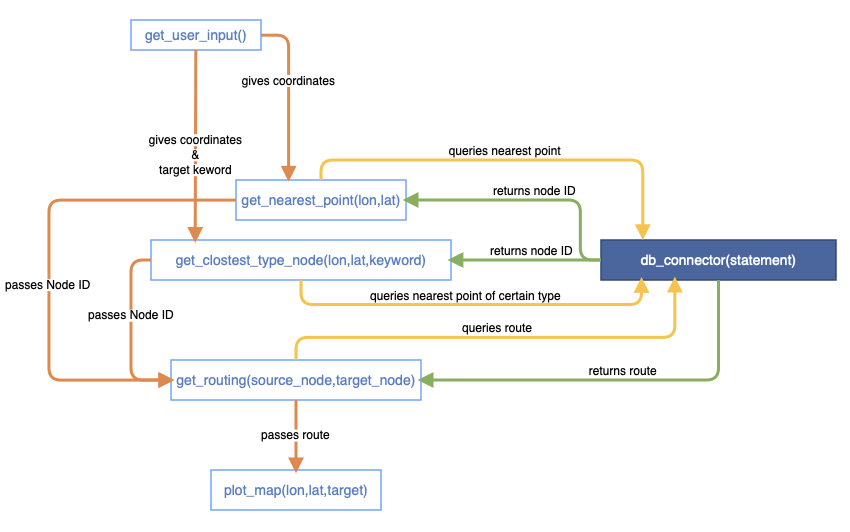
As outlined in the schema above, the python connector consists of 6 methods. The methods do the following (simplification):
- db_connector(statement): receives an SQL statement, connects to the database via the user ‘bot_annakirmes’ and returns the server answer.
- get_user_input(): queries user coordinates in WGS84 4326 as well as the type of target booth, corrects for invalid coordinates and taget type.
- get_nearest_point(lon,lat): receives user coordinates from get_user_input(), queries server for nearest routable network node and returns server answer.
- get_closest_type_node(lon,lat,keyword): receives user coordinates and taget keyword from get_user_input(), formulates SQL query to server to find nearest booth of desired type, returns server answer.
- get_routing(source_node,target_node): receives two node while being called with get_nearest_point(…) and get_closest_type_node(…) as it’s arguments, constructs routing statement for dijkstra’s algorithm and returns routing result joined with geometries from routable network.
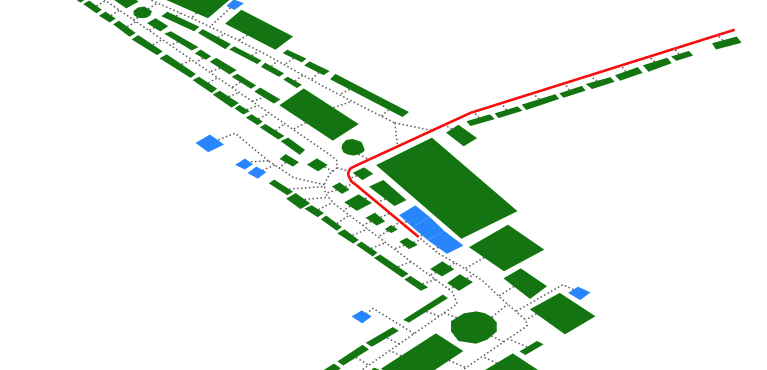
- plot_map(lon,lat,target): is called with pervious methods as arguments, prints out map. Also queries the server for utilities, marketeers and footpaths and visualizes those as background for the map, superposing the route in red over the footpaths.
The python command to start the whole process from within the .py file looks like this:
lon,lat,target = get_user_input()
plot_map(get_routing(get_nearest_point(lon,lat),get_closest_type_node(lon,lat,target)))
8. Visualization of Results via Matplotlib
As mentioned before, the geometry return of the route from the server is converted to Extended Well Known Text (Extended meaning there is SRS Information before the geometries). The return is converted by the get_geopandas_from_return() function and returnes as a geopandas table, where shapely converts the EWKT to a geopandas conform format. This table can then be easily displayed using matplotlib. In order to make navigation and orientation easier, the geometries from the marketeers, utilities and footpaths layer is also converted to a geopandas table and then plotted.
An interesting sidenote is that the last geometry of the routing return is note relevant to the route and falsely continues the routing along the ‘main’ path. The last element should therefore be excluded from visualization.
-- Statements to fetch all gemoetries from the carnival grounds
SELECT ogc_fid, business, name, ST_AsEWKT(st_transform(geom,4326)) AS geom FROM marketeers;
SELECT id, ST_AsEWKT(st_transform(geom,4326)) AS geom FROM footpaths;
SELECT ogc_fid, type, ST_AsEWKT(st_transform(geom,4326)) AS geom FROM utilities; 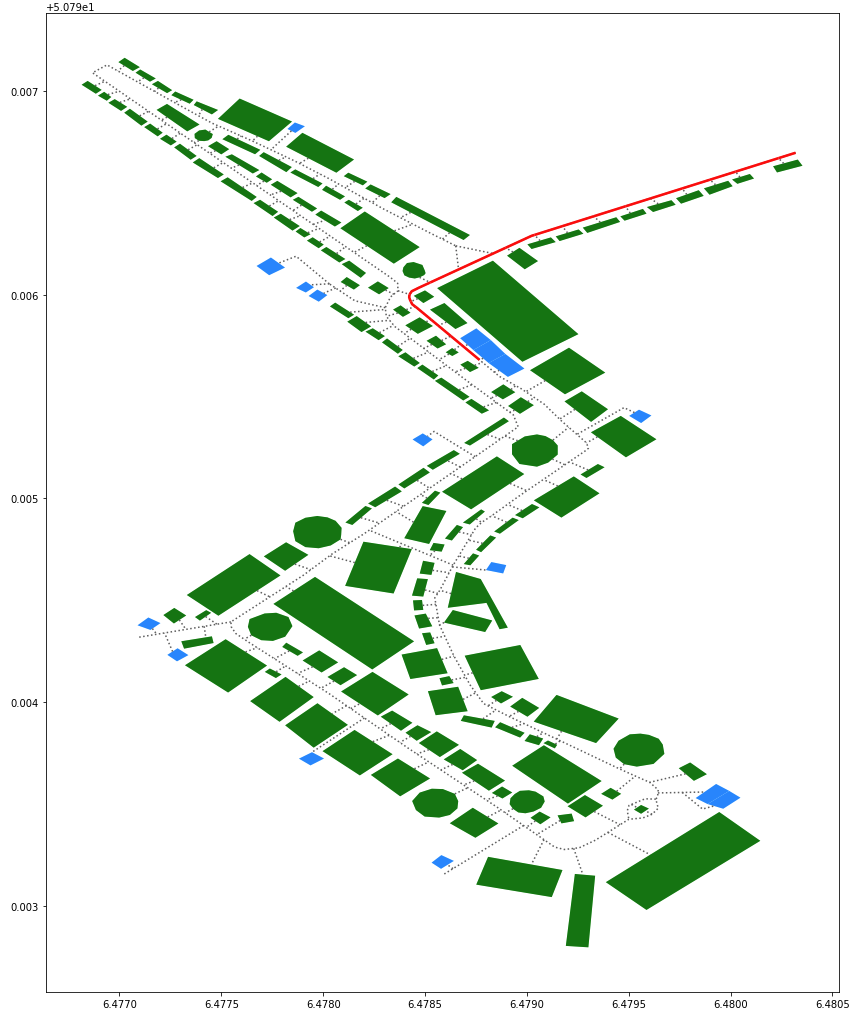
9. Demonstration
The video below gives a quick overview of the functionality, the Python DB connector is run in JupyterHub.As noted before, the routing is not yet completely functional. The demonstration below was performed with source coordinates and a target that is known to work, so the video below should be considered more of a proof of concept.
Addendum
The code for the Python DB Connector (without the DB pasword) is posted below, but can also be found on GitHub.
#!/usr/bin/env python3
# -*- coding: utf-8 -*-
"""
Created on Sun Feb  7 20:10:25 2021

@author: simondonike
"""


""" returns server answer for given SQL statement"""
def db_connector(statement):
    import psycopg2
    return_ls = []
    try:
       connection = psycopg2.connect(user="bot_annakirmes",
                                      password="XXXXXXXXXXX",
                                      host="85.214.150.208",
                                      port="5432",
                                      database="annakirmes")
       cursor = connection.cursor()
       sql_Query = statement

       cursor.execute(sql_Query)
       #print("Selecting rows from mobile table using cursor.fetchall")
       mobile_records = cursor.fetchall()

       #print("Print each row and it's columns values")
       for row in mobile_records:
           return_ls.append(list(row))

    except (Exception, psycopg2.Error) as error :
        print ("Error while fetching data from PostgreSQL: ", error)

    finally:
        #closing database connection.
        if(connection):
            cursor.close()
            connection.close()
            #print("PostgreSQL connection is closed")

    return return_ls


"""Save geojsons to disc with prefix to indicate data"""
def export_geojsons(geojsons_ls,name_prefix):
    import geojson
    json_ls = []
    for i in geojsons_ls:
        json_ls.append(i[-1])
    counter = 1
    for i in json_ls:
        #geojson.dump(i,input_name+"_geojson_"+str(counter)+".geojson")

        with open("geojsons/"+name_prefix+"_json_"+str(counter)+".geojson", 'w') as outfile:
            geojson.dump(i, outfile)
        counter=counter+1


""" Gets Lat.Lon, returns nearest node id from dataabase"""
""" construct sql statement of point w/ lat,lon pased in WGS84/4326"""
def get_nearest_point(lon,lat):
    sql_nearest_point = """SELECT id,
                          ST_Distance(
                            the_geom,
                            ST_Transform(
                                ST_SetSRID(
                                    ST_MakePoint("""+str(lon)+","+str(lat)+ """),4326),3857)) AS dist
                        FROM footpaths_noded_vertices_pgr
                              ORDER BY dist LIMIT 1;"""
    sql_return = db_connector(sql_nearest_point)
    #since list of list, return only first entry
    #print("closest node id to coordinate: "+ str(sql_return[0][0]) + "\tdistance: "+ str(round(sql_return[0][1],2)) + "m")
    return(sql_return[0][0])


""" receives string of table name, returns geom GeoJSONs for each entry (in 3857, i think)"""
def get_polygons(unit_type):
    if unit_type=="marketeers":
        sql_statement = "SELECT ogc_fid, business, name, ST_AsEWKT(st_transform(geom,4326)) AS geom FROM marketeers;"
    if unit_type=="exit_points":
        sql_statement = "SELECT ogc_fid, name, ST_AsGeoJSON(geom) AS geom FROM exit_points;"
    if unit_type=="utilities":
        sql_statement = "SELECT ogc_fid, type, ST_AsGeoJSON(geom) AS geom FROM utilities;"
    if unit_type=="footpaths":
        sql_statement = "SELECT id, ST_AsGeoJSON(geom) AS geom FROM footpaths;"
    if sql_statement!="":
        return db_connector(sql_statement)


"""reuest database for nearest node from point, list woth GeoJSONs in last place"""
def get_routing(source_node,target_node):


    #print("source node: ",source_node)
    #print("target node: ",target_node)
    #bringing nodes in right order, from small to big, otherwise routing fails
    if source_node<target_node:
        node_statement = str(source_node)+","+str(target_node)
    if source_node>=target_node:
        node_statement = str(target_node)+","+str(source_node)
    #construct SQL statement
    sql_statement = """SELECT seq, path_seq, node, edge, directions.cost , agg_cost, ST_AsEWKT(ST_TRANSFORM(geom,4326)) as geom
    FROM pgr_dijkstra('SELECT id,source,target ,st_length(geom) as cost FROM footpaths_noded',"""+node_statement+"""
    ,false)as directions JOIN footpaths_noded fn ON directions.node = fn.id;"""
    #return database answer

    #print(sql_statement)
    server_answer = db_connector(sql_statement)
    #agg_dist = round(server_answer[-1][-2],2)
    #print("length of route from node to target: "+str(agg_dist))
    #print(server_answer)
    return server_answer


"""receives point and destination type, returns closes node id of type"""
def get_closest_type_node(lon,lat,keyword):
    # check if keyword is valid
    if keyword in ["ride","misc","gastronomy","Toilet","Head Office","First Aid","Kid's Office"]:
        #construct sql statment with keyword
        sql_statement = """SELECT ver_id, ST_Distance(wkb_geometry,ST_Transform(ST_SetSRID(ST_MakePoint(
        """+str(lon)+","+str(lat)+"""),4326),3857)) AS dist FROM vertices_sampled
        WHERE ut_type = '"""+keyword+"' OR mar_bus= '"+keyword+"' ORDER BY dist LIMIT 1;"

        #save server answer
        server_answer = db_connector(sql_statement)
        #extract node, turn into int
        target_node = int(server_answer[0][0])
        return target_node


""""Saves all GeoJSONs of all info locally"""
def refresh_GeoJSON_library():
    export_geojsons(get_polygons("marketeers"), "marketeers")
    export_geojsons(get_polygons("utilities"), "utilities")
    export_geojsons(get_polygons("footpaths"), "footpaths")
    export_geojsons(get_polygons("exit_points"), "exit_points")


"""Example for plotting"""
def get_geopandas_from_return(sql_return):
    import pandas as pd
    import geopandas
    from shapely import wkt
    ls_1 = []
    for i in sql_return:
        ls_1.append([i[0],i[-1][10:]])
    df_1 =pd.DataFrame(ls_1)
    df_1 = df_1.rename(columns={0: 'ID', 1: 'geometry'})
    df_1['geometry'] = df_1['geometry'].apply(wkt.loads)
    gdf_1 = geopandas.GeoDataFrame(df_1, geometry='geometry')
    return gdf_1


"""PLT plot maps, takes route from server as input and plots map w/ background """
def plot_map(route_server):
    gpd_marketeers = get_geopandas_from_return(db_connector("SELECT ogc_fid, business, name, ST_AsEWKT(st_transform(geom,4326)) AS geom FROM marketeers;"))
    gpd_footpaths = get_geopandas_from_return(db_connector("SELECT id, ST_AsEWKT(st_transform(geom,4326)) AS geom FROM footpaths;"))
    gpd_utilities = get_geopandas_from_return(db_connector("SELECT ogc_fid, type, ST_AsEWKT(st_transform(geom,4326)) AS geom FROM utilities;"))
    gpd_route = get_geopandas_from_return(route_server)
    import matplotlib.pyplot as plt
    fig,ax=plt.subplots()
    fig.set_size_inches(18, 18)
    ax.set_aspect('equal')
    gpd_marketeers.plot(ax=ax,color='green',label="Marketeers")
    gpd_utilities.plot(ax=ax,color='dodgerblue',label="Utilities")
    gpd_footpaths.plot(ax=ax,color='dimgray',linestyle=':',label="Footpaths")
    gpd_route.plot(ax=ax,color='red',linewidth=2.5,label="Route")
    plt.show()

"""Get user Coordinates & Type of Target, returns Coor & target keyword for DB"""
def get_user_input():
    # get lat
    lat = 0.0
    while type(lat) != float or lat<50.0 or lat>51.0:
        lat = input("\nEnter your Coordinates!\nLatitude: ")
        lat = float(lat)
        if type(lat) != float or lat<50.0 or lat>51.0:
            print("Invalid input! Give Latitude as float, in the general area of the carnival grounds!")
    # get lon
    lon = 0.0
    while type(lon) != float or lon<6.0 or lon>7.0:
        lon = input("Longitude: ")
        lon = float(lon)
        if type(lon) != float or lon<6.0 or lon>7.0:
            print("Invalid input! Give Latitude as float, in the general area of the carnival grounds!")
    # get user target
    user_input = 0
    while user_input not in [1,2,3,4,5,6,7,8]:
        user_input = input("\nWhere do you want to go? Enter a number!\nto the nearest....\n\t1 - Gastronomy\n\t2 - Carnival Ride\n\t3 - Entertainment Booths\n\t4 - Misc. Vendor\n\t5 - Toilet\n\t6 - First Aid Station\n\t7 - Kid's Office\n\t8 - Carnival Organizational Office\n\tInput: ")
        user_input = int(user_input)
        if user_input not in [1,2,3,4,5,6,7,8]:
            print("Invalid input, please enter a number!")
    target_dict = {
        1:"gastronomy",
        2:"ride",
        3:"entertainment",
        4:"misc",
        5:"toilet",
        6:"First Aid",
        7:"Kid's Office",
        8:"Head Office"}
    return[lon,lat,target_dict[user_input]]

# Start user input and routing
lon, lat, target = get_user_input()
plot_map(get_routing(get_nearest_point(lon,lat),get_closest_type_node(lon,lat,target))) 

