Flooding Event at ‘Inden’ Open Pit Mine – 3D Analysis

Table of Contents

Introduction

During the flooding event of 2021 in Europe and western Germany in particular, many regions were flooded and erosion events occured. Using Photogrammetry and a drone, the erosion event near the Inden open pit mine was surveyed and a 3D model created.

Location

Within the rhenish coal district (german: “Rheinisches Braunkohlerevier”), the Inden open pit mine is the western-most still active mine. With an extent of currently about 1500 hectares and a depth of up to 230 meters, this particular mine is one of the smaller ones in the area. 

Flooding Event
Image 1: Altenahr, Germany, 15.07.2021 (CC-0).

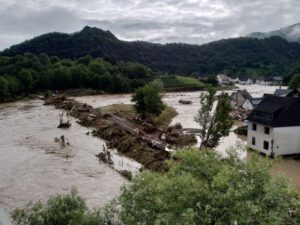
Beginning on the 12th of July 2021, heavy rain devastated many areas in western Germany, hitting the ‘Eifel’ region especially hard. While many villages in valleys were flooded and destroyed, the floods also caused heavy damages in the lowlands. While some rivers could take on the water flowing out of the mountains, many especially smaller rivers overflooded.

Inde River

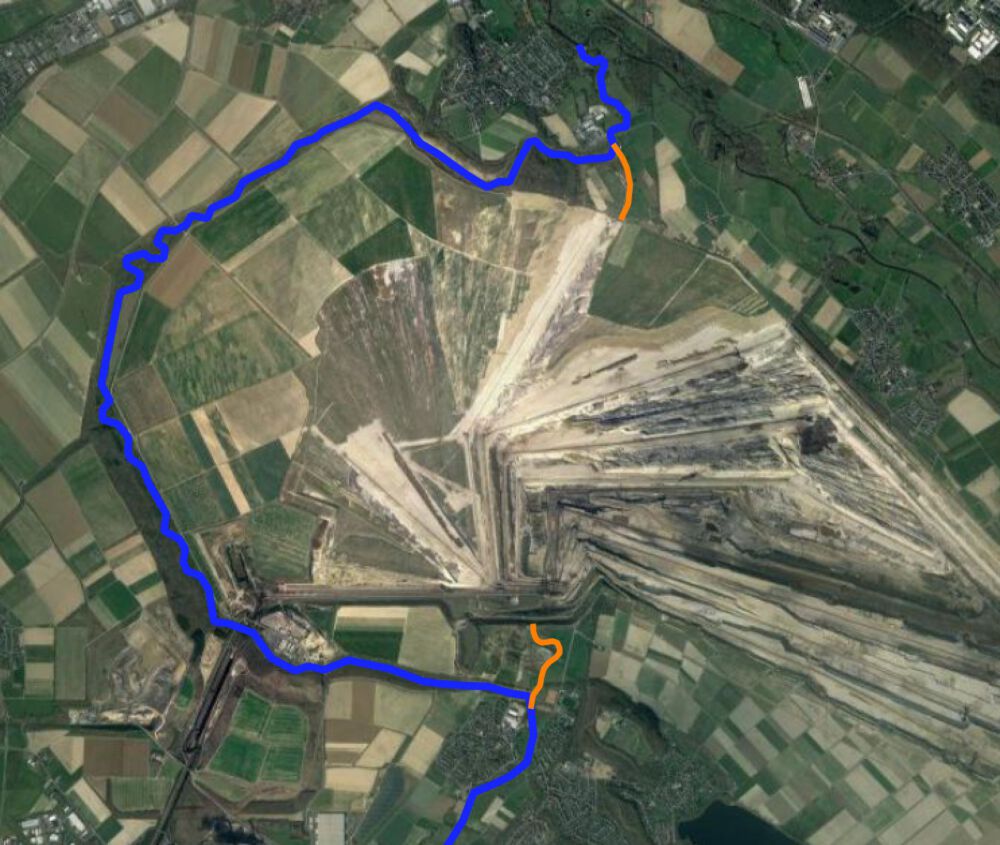
The Inde, a relatively small river with a length of just over 50km, flows from its source in the mountainous border region between Germany and Belgium to join the Rur river in Jülich. The river was rerouted in 2005 in order to make space for the expanding open pit mine. The former riverbed is still visible in aerial imagery.

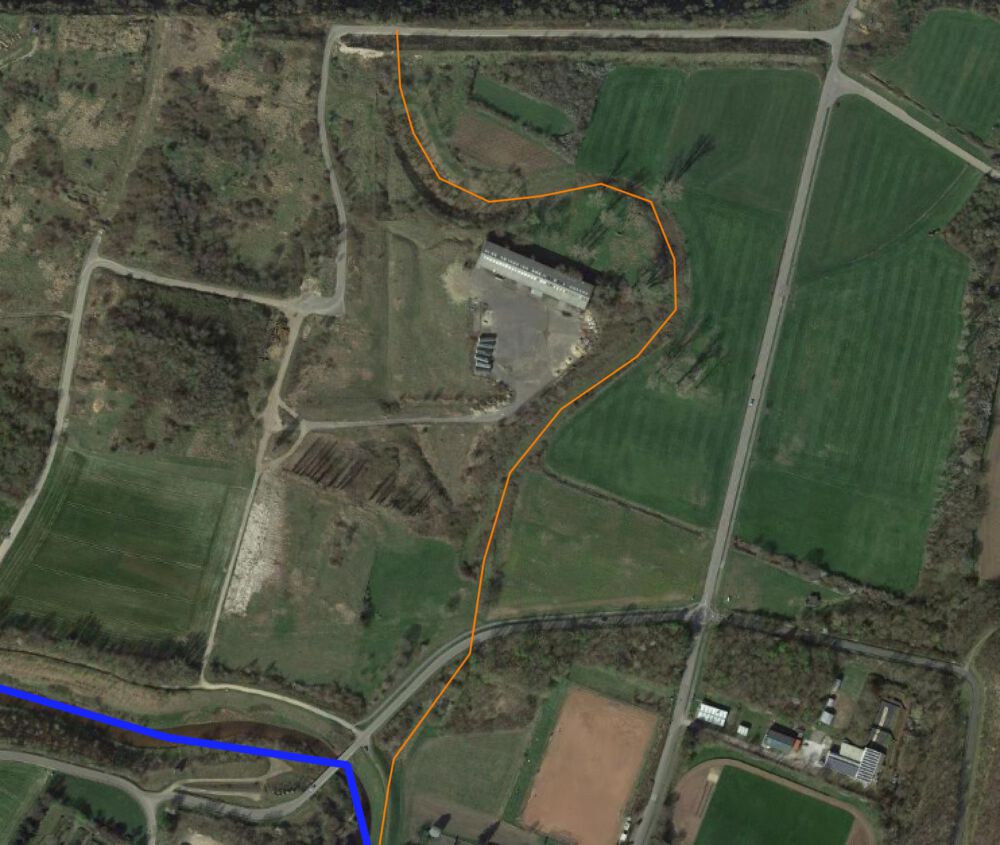
On the 12th of July, the heavy rains caused the river Inde to swell significantly. Flowing debris blocked a bridge nearby, blocking the river and suddenly forcing the water to exit the riverbed and flood the area. The water reclaimed the former riverbed and flowed into the mine.

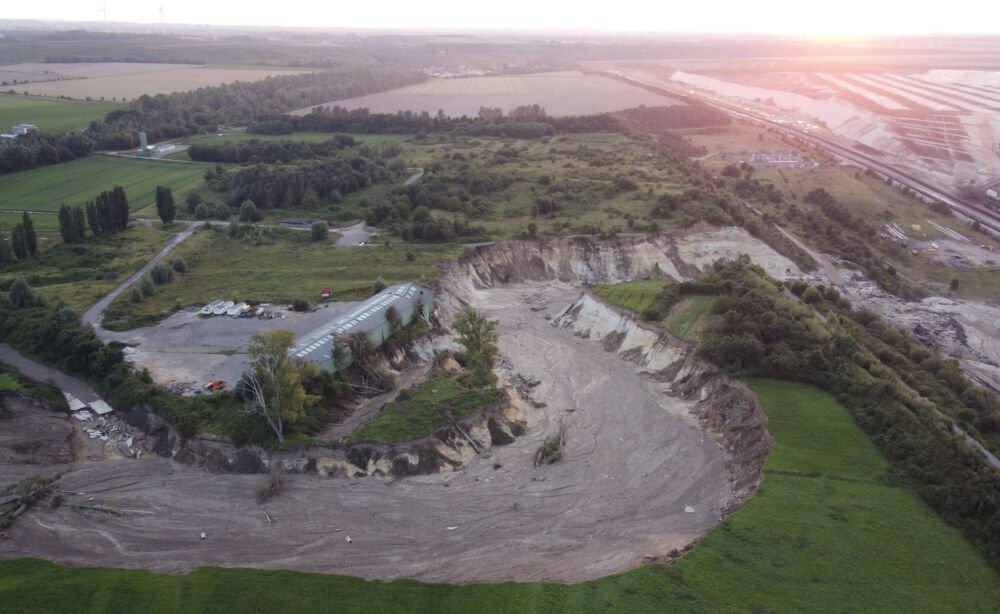
While the area has formerly been flat and mostly used as a field, the water into reclaiming its old riverbed caused a canyon-like erosion pattern in the field. The potential energy due to the height difference of the field to the mine caused the backpropagation of the edge, removing more and more material from the field until the flooding was stopped about 12 hours later. The flooding could be stopped by removing debris caught on the bridge, allowing the river to follow its usual path again.

Image 2: Open pit mine Inden. Current riverbed of the Inde river (blue) and remaining former riverbed (orange). The current Area of Interest is the southern former riverbed [Sat Image: Google Earth XYZ-Tiles].
Image 3: Current (blue) and former (orange) riverbed at the southern side of the open pit mine. The former riverbed is clearly visible due to different vegetation cover [Sat Image: Google Earth XYZ-Tiles].
Image 4: Overview over the AOI and the canyon, 2 weeks after the event.

Data Acquisition

Using a DJI Mavic Mini, the area was photographed from above. Since this drone model does not natively support waypoint and capture missions, a third party software was used. The Dronelink software enables the drone to systematically cover a user-defined polygon and automatically take pictures at the right intervals.

The total flight time was 49 minutes, special care has been taken to respect the local laws regarding the operation of drones. A total of 631 nadir-looking images were taken with a front overlap if 80% and a side overlap of 70%, the image size is 4000×2250 px. The 60m AGL flight height results in a ground sampling distance of 2.13 cm/px. 

Image 5: Dronelink mapping mission overview.
Table 1: Dronelink mission parameters. Note the GSD and the size of 19.9ha.
Table 2: Mission estimates.

3D Model Creation

A 3D model point cloud with 40,000,000 points was created from the images. The point cloud was then transformed into a DSM and an orthophoto. Due to processing limitations, the DSM only has a GSD of 10cm/pixel, while the orthophoto is in full resolution.

Dense Point Could
Orthomosaic
Image 6: Google Sat XYZ-Tile of the AOI.
Image 7: Same area, overlaid with the created orthomosaic.
DSM
Image 7: DSM.
Image 7: DSM.
Image 8: Slope.
Image 8: Slope.

Calculating volume of eroded soil

In order to find out the volume of the soil that was swept into the pit mine, the DTM published by the state authorities was consulted. Even though the DTM does not include buildings and vegetation while the DSM created in this workflow does, the altitude of the field and the embankment of the mine is the same. Therefore, the altitude difference between the DTM before the event to the DSM from after the event is the change in volume. 

The images used for the creation of the DEM via photogrammetry were referenced in their altitude via 6 GCPs, using the altitude from the state-published DSM. The accuracy error as well as the reference between the two rasters should not be significant (internal reference error: ≈3cm).

Image 9: DTM published by the state, before the flood. Note the former riverbed, which is about 2m below the surface level of the field.
Image 10: DSM after the flood.

By calculating the average pixel difference value for the canyon (-9.212m) and taking the surface area of the canyon (55,510.04m2), the conclusion is that 511,358.49m3 of soil have been eroded. The newly formed canyon has a maximum depth of 28.6m.

Conclusion

During the flood, a canyon with a maximum depth of 28.6m was created and over 510,000 square meters of soil have been eroded, weighing an estimated 920,000 metric tons (920 million kilograms). All of the eroded material ended up in the pit mine, accumulating and raising the terrain by more than 15m.

While looking at the local conditions, it is certain that it was a mistake not to completely even out the former riverbed. The ditch gave the water a clear path to follow, ending up at the edge of the mine. Fast flowing speeds due to the thin river bed caused the backwards erosion starting at the edge. If the field would have been mostly flat, the field would have flooded evenly with the water entering the open pit mine not in one spot but instead on a larger area. Potentially, the water might not even have found the way north but instead would have been redirected towards the south-west.

Image 11: Difference in elevation from before and after the event, classified. In addition to the erosion of the canyon, the accumulation of material in the mine is also visible, raising the terrain by up to 15m.

Leave a Reply

Your email address will not be published. Required fields are marked *

Further Reading
Recent Updates