This post shows both the code and the result from Google Earth Engine’s reduced Charts by region for 4 selected mountaintops around the world.
// Define a FeatureCollection: regions of Salzburg.
var regions = ee.FeatureCollection([
ee.Feature( // Gaisberg.
ee.Geometry.Point(13.111960238822803,47.804202642468331), {label: 'Gaisberg (1288m)'}),
ee.Feature( // Grossglockner.
ee.Geometry.Point(12.693900,47.074531), {label: 'Großglockner (3798m)'}),
ee.Feature( // MtBlanc.
ee.Geometry.Point(6.864325,45.832544), {label: 'Mt. Blanc (4809m)'}),
ee.Feature( // Aconcagua.
ee.Geometry.Point(-70.011667,-32.653333), {label: 'Aconcagua (6961m)'})
]);
// Load Landsat 8 brightness temperature data for 1 year.
var temps2016 = ee.ImageCollection('LANDSAT/LC08/C01/T1_32DAY_TOA')
.filterDate('2016-12-25', '2018-12-25')
.select('B11');
print(temps2016);
// Create a time series chart.
var tempTimeSeries = ui.Chart.image.seriesByRegion(
temps2016, regions, ee.Reducer.mean(), 'B11', 50, 'system:time_start', 'label')
.setChartType('ScatterChart')
.setOptions({
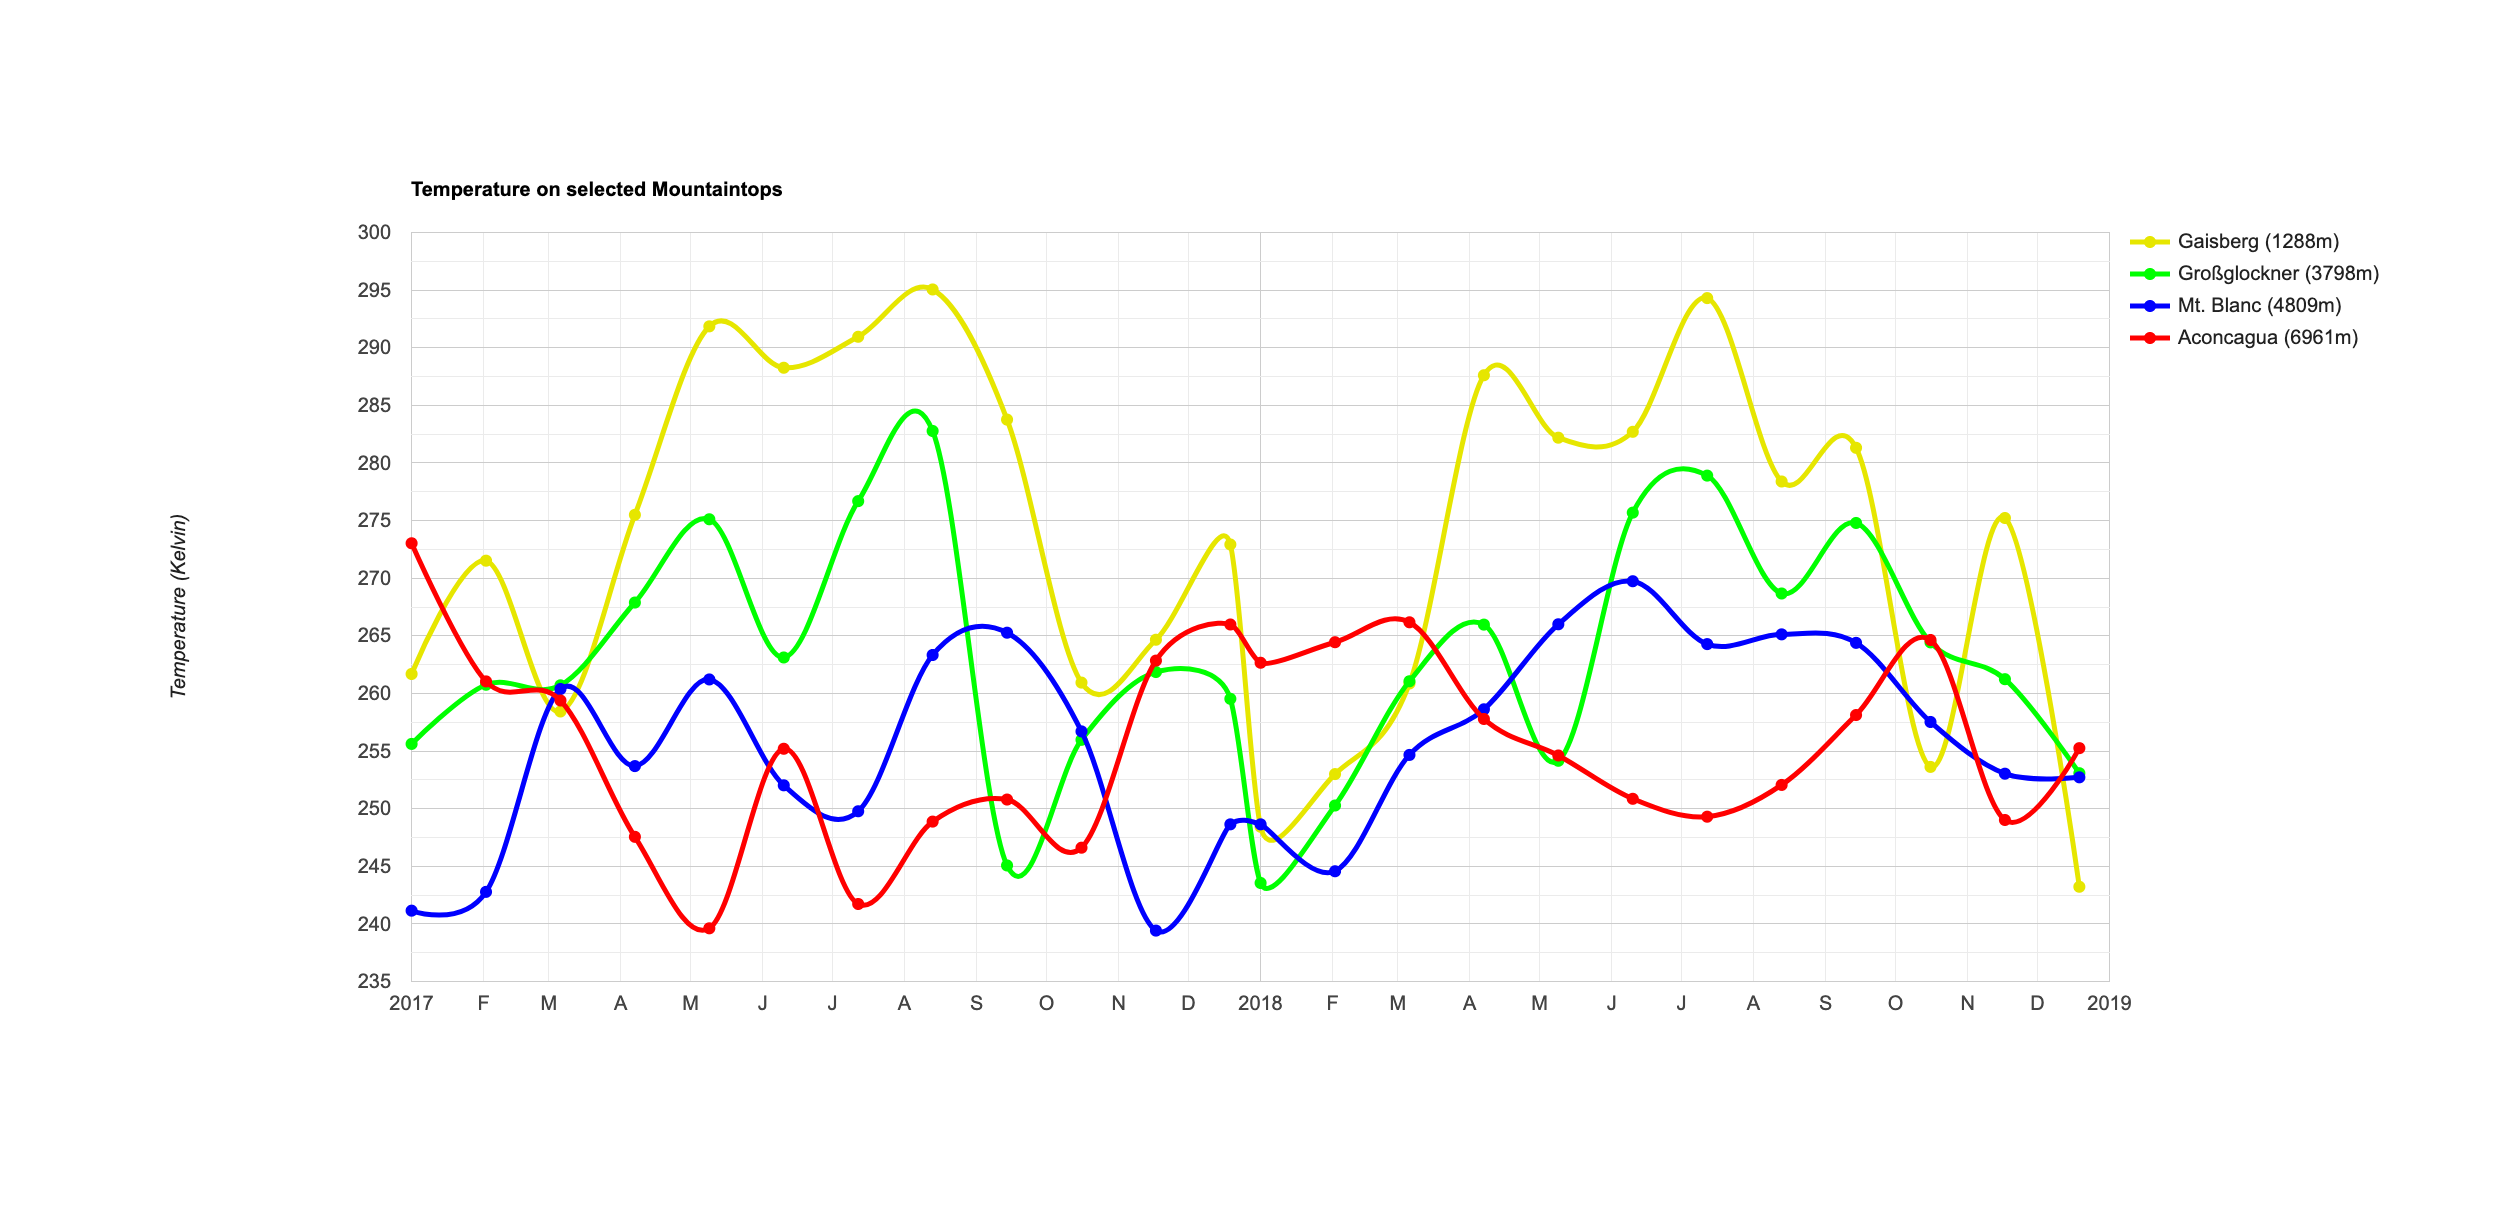
title: 'Temperature on selected Mountaintops',
vAxis: {title: 'Temperature (Kelvin)'},
curveType: 'function', // smoothen Curve
lineWidth: 5, //optimizing visualization on web page
pointSize: 10, //optimizing visualization on web page
series: {
0: {color: 'e6e600'}, // dark yellow
1: {color: '00FF00'}, // green
2: {color: '0000FF'}, // blue
3: {color: 'FF0000'} // red
}});
// Display
print(tempTimeSeries);