Table of Contents
1. Introduction
This blog post compares land cover classifications performed on different datasets. The images were acquired using a DJI Phantom 4 on the 25th of November 2021, using the standard on-board RGB camera as well as a Near-Infrared (NIR) and Red Edge (RE) sensor near Lancieux, Bretagne. Since this specialized sensor also measures the sun radiance, the actual reflectance values are automatically obtained on-chip by subtracting these values from the captured pixel values.
The goal of this comparison is to see how the aforementioned Orthoimages as well as the DSM of the area contribute to a successful image classification. The goal is not to refine the classification algorithm, but instead see how different data types impact the classification.
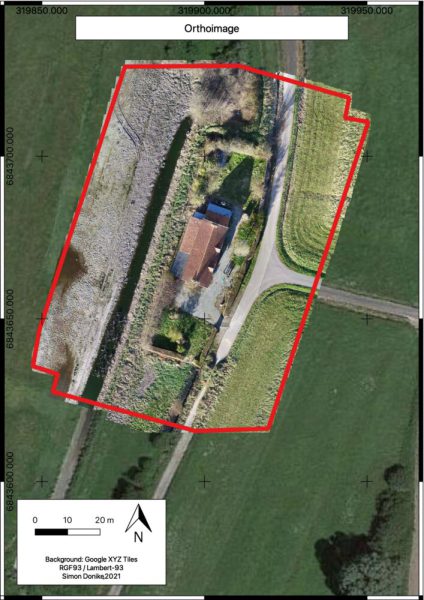
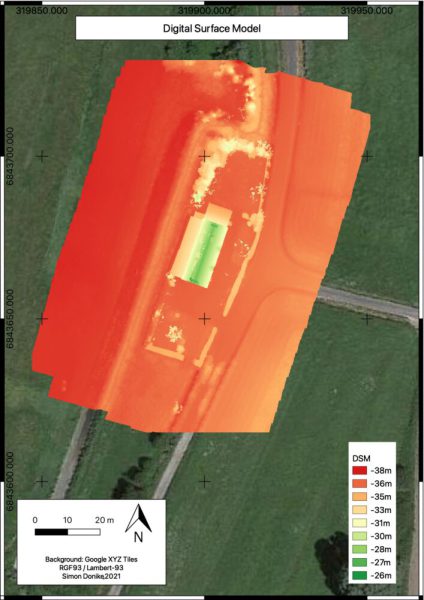
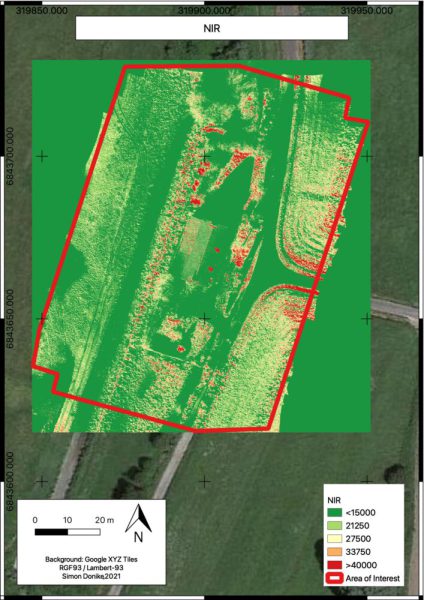
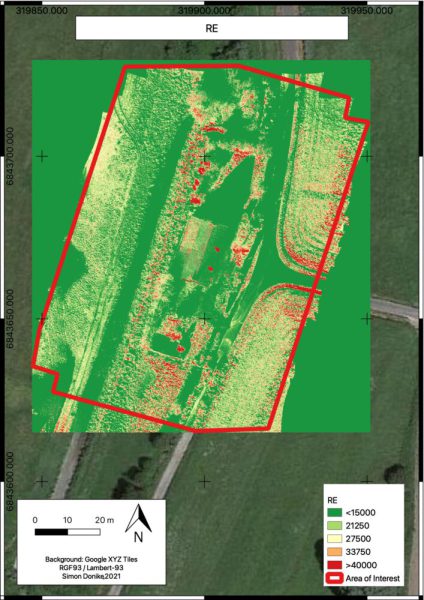
The datasets were processed using Agisoft Metashape.
2.2. Classification Dataset for Training and Validation
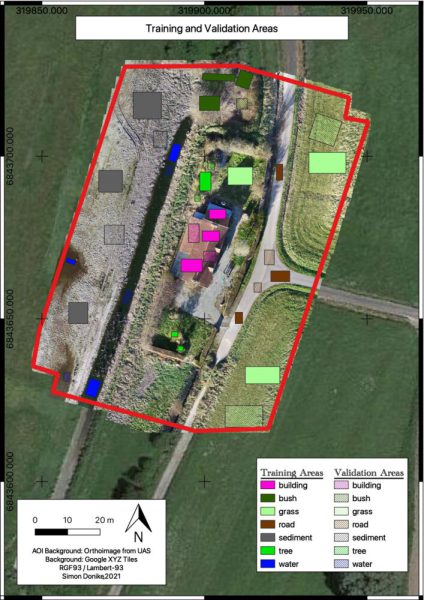
3. Classification Algorithm
3.1 Classification Based on RGB
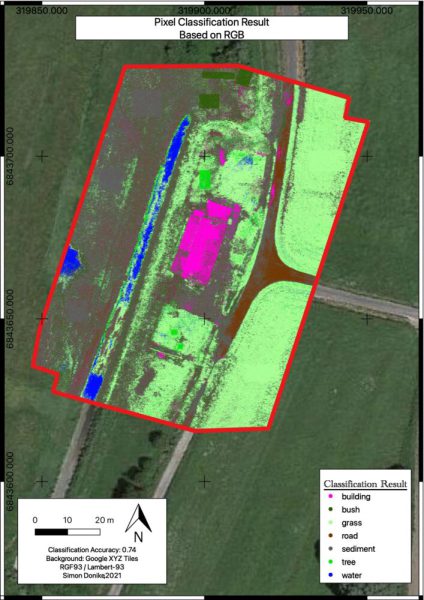
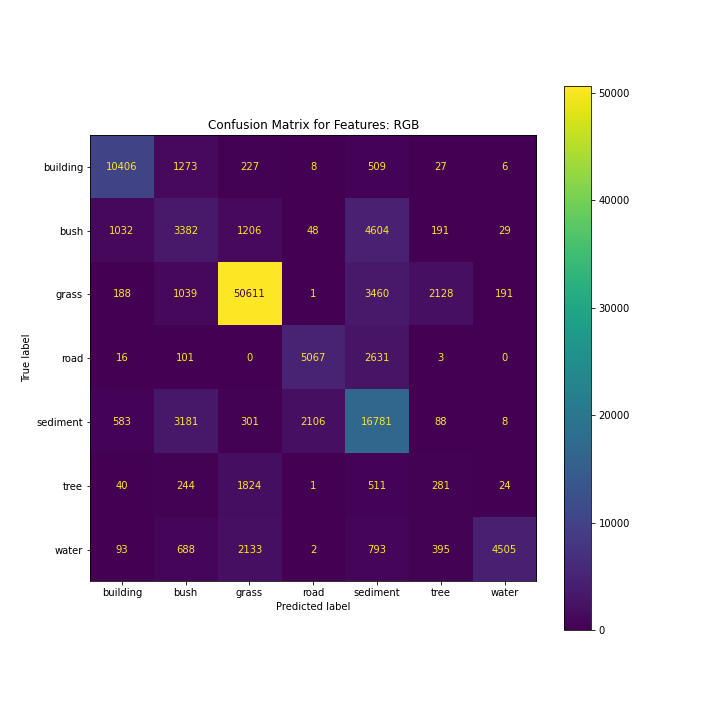
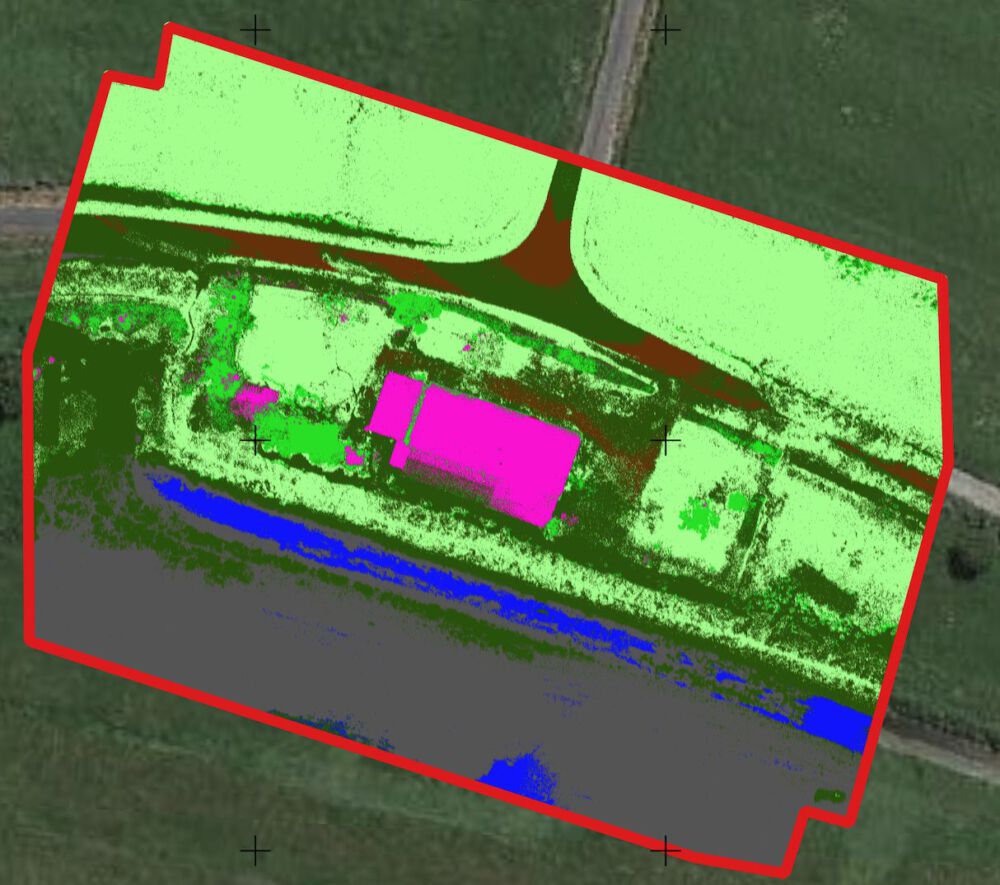
The classification based on RGB values alone returns an accuracy of 0.74 on the validation set. The main problem seems to be the distinction between the bush and sediment classes, since the bushes have a similar color to the sediment. Very clearly visible are the training areas, since the algorithm has seen these data points before and classifies them accordingly.
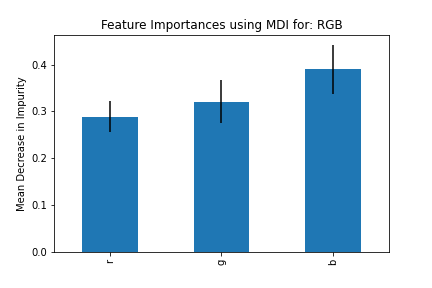
3.2 Classification based on RGB and DSM
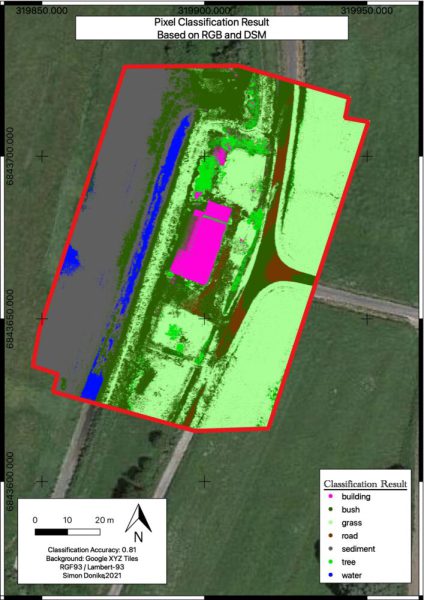
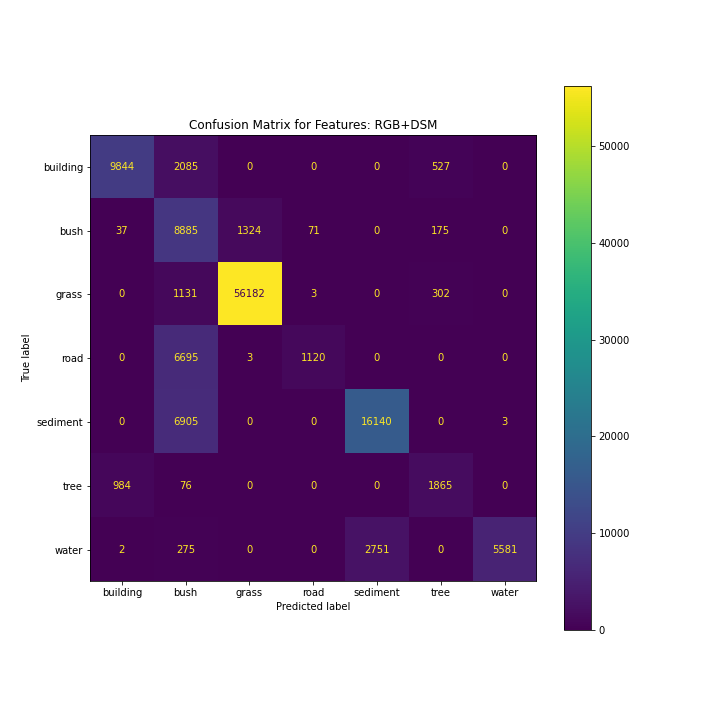
Including the DSM results in a better classification in many areas, for example the roof for which height is a good discriminator. On the other hand, the spectral signature looses importance, leading to confusions especially between the bush and road classes. Still, the overall accuracy is slightly increased to 0.81.
3.3 Classification based on RGB and NIR
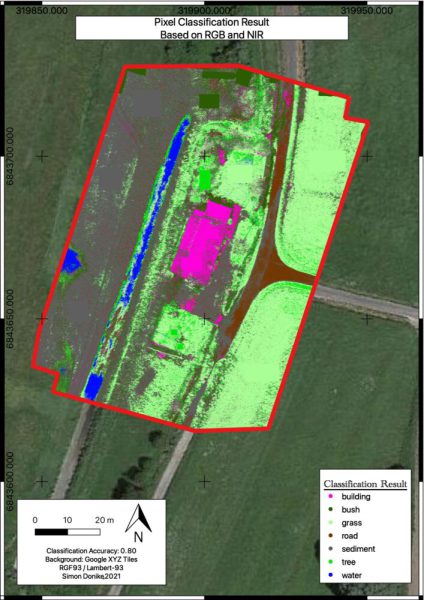
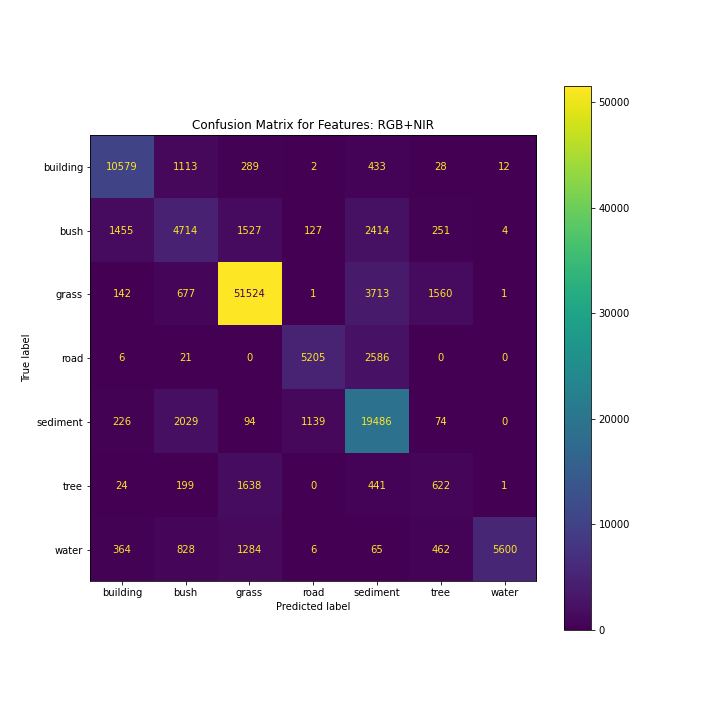
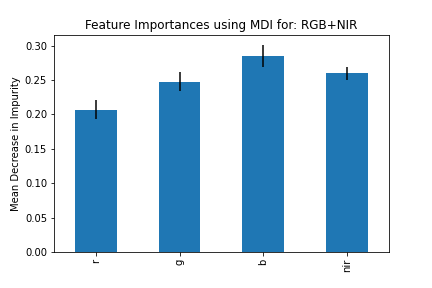
The RGB+NIR combination leads to a better distinction between vegetation and non-vegetation classes. Detecting the bushes and trees is still a problem, since the spectral signature seem to be similar to the other vegetation classes. The algorithm might be quite heavily overfitted, since the training dataset polygons are highly visible in the final classified image. The final accuracy is 0.80, with all spectral bands having a similar feature importance.
3.4 Classification based on RGB and RE
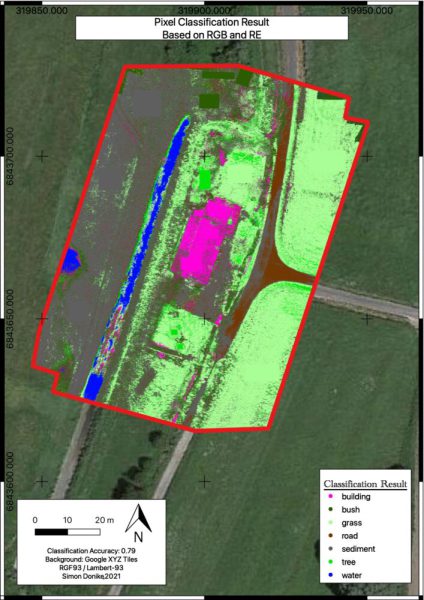
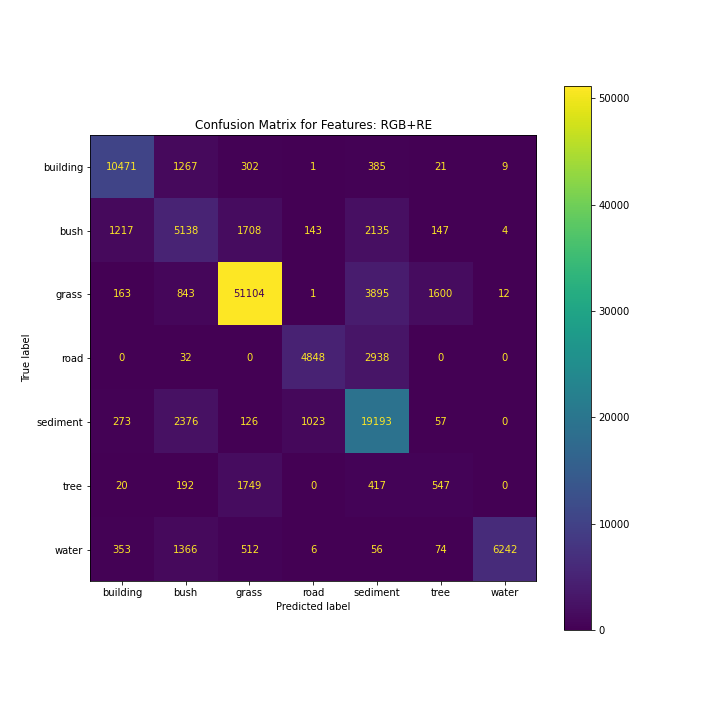
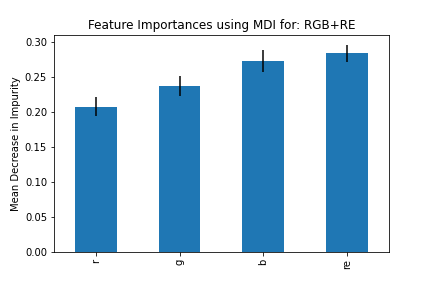
The combination of RGB and RE performs slightly worse, since the vegetational aspect is lost a bit compared to the RGB+NIR combination. Still, the overall accuracy is 0.79.
3.5 Classification based on RGB, DSM, IR, and RE
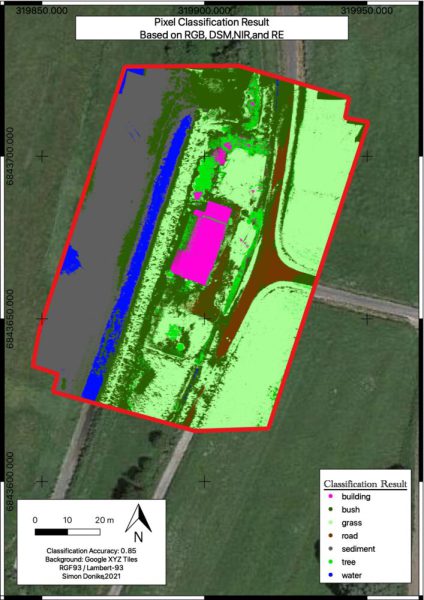
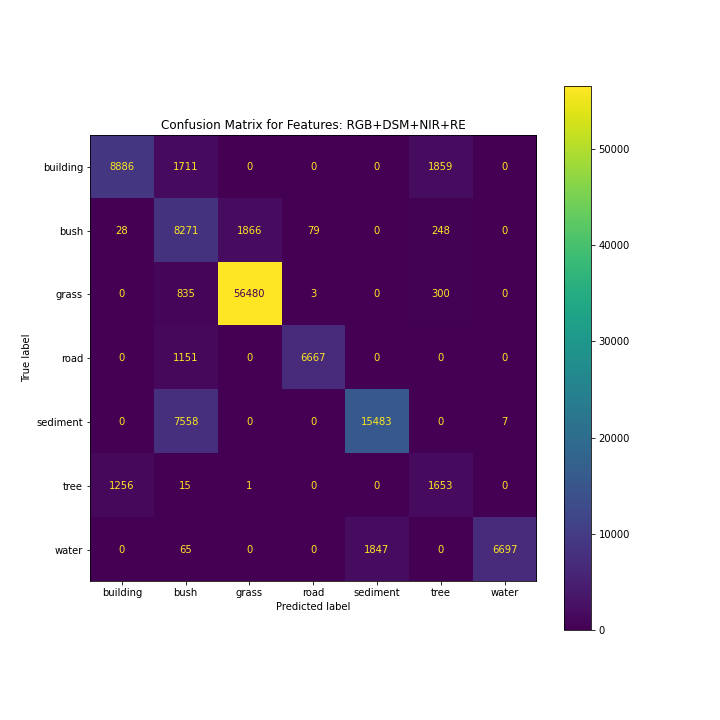
The final combination, including all data sources, leads to the best result. The grass, sediment and water are classified very well. Some problems are still present in the distinction between the tree and bush classes, which is a problem for all combinations. The accuracy is 0.85. The building is also accurately delineated, while segments of the road are misclassified as bush.
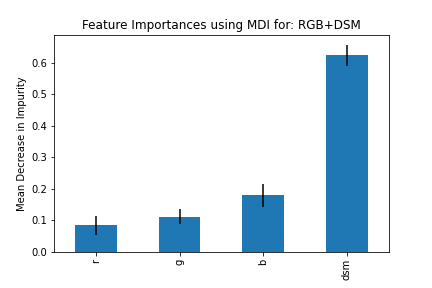
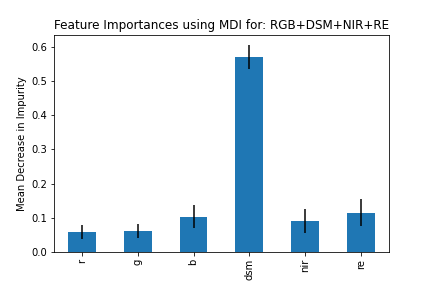
Interestingly, the DSM is still the most important feature. In my opinion, this is due to the difference in height of the house and the other areas. If the difference in the spectral bands is not too high, an important feature might be the altitude of the pixel. With the domain knowledge in mind, potentially not taking the DSM into account would lead to a better result.
4. Conclusion
In this test, the combination of all data types lead to the best result. The NIR band helped identify and separate vegetation classes from the other classes, having a higher impact on the correct identification than the RE band. While the DSM had some high feature importance scores and also lead to improvements in accuracy, but also introduced some noise into the classification.
While some overfitting was observed, the optimization of the classifier was not the main motivation but rather the differences in accuracy of the different data combinations.
- Accuracy of RGB: 0.74
- Accuracy of RGB + DSM: 0.81
- Accuracy of RGB + RE: 0.79
- Accuracy of RGB + IR: 0.80
- Accuracy of RGB + DSM + NIR + RE: 0.85
5. Appendix 1 – Improved Verification Dataset
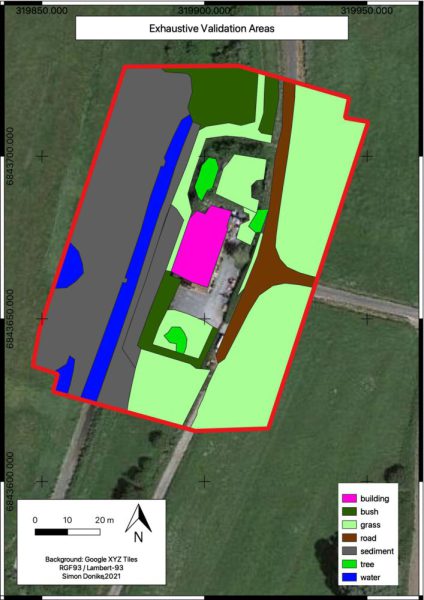
This verification method came to the following results:
- Accuracy of RGB: 0.65
- Accuracy of RGB + DSM: 0.73
- Accuracy of RGB + RE: 0.68
- Accuracy of RGB + IR: 0.68
- Accuracy of RGB + DSM + NIR + RE: 0.73
In general, the accuracies are lower than the accuracies of the previous method. This is most likely due to the larger verification areas, capturing a bigger internal difference if the classes. This method is more likely to accurately reflect the actual prediction quality.
While the absolute accuracy values are different in this verification method than the previous one, the relative accuracies still follow the same patterns as previously. This shows that the underlying quality of the data and its power to represent the underlying phenomena is the driver behind the differences in accuracy, not the classification method itself.
6. Appendix 2 – Neural Network Classifier
Just out of curiosity a Neural Network was implemented as a classifier instead of the Random Forest for the same dataset and verification areas as described in Appendix 1. Since the data is the same, the resultsare comparable and diferences in accuracies are only due to tue classifiers themselves. Some of the combinations unfortunately suffer from ‘neuron death’, which at this stage is to time-consuming to fix.
See the code for the NN here.
- Accuracy of RGB: 0.67
- Accuracy of RGB + DSM: 0.79
- Accuracy of RGB + RE: 0.40 (Neuron Death)
- Accuracy of RGB + IR: 0.40 (Neuron Death)
- Accuracy of RGB + DSM + NIR + RE: 0.68

