Table of Contents
1. Area of Interest
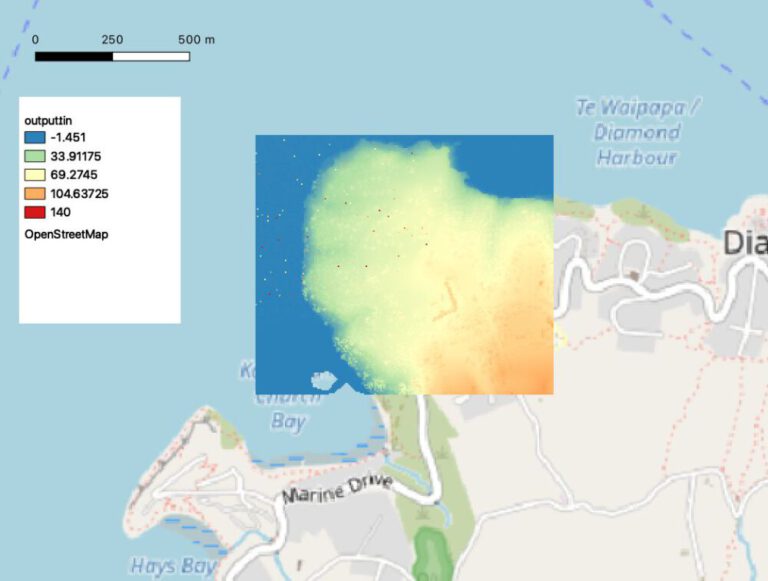
The area of interest is south of Christchurch, New Zealand in the seaside community of Diamond Harbor. The area is roughly 80 ha big, spanning a forested residential area and the ocean. The altitude ranges from 0m (sea level) to ca. 120m. Ideally, some changes like new garages or renovations will be visible. Additionally, it might be interesting to see different sea levels due to the tide changing.
2. Importing Data
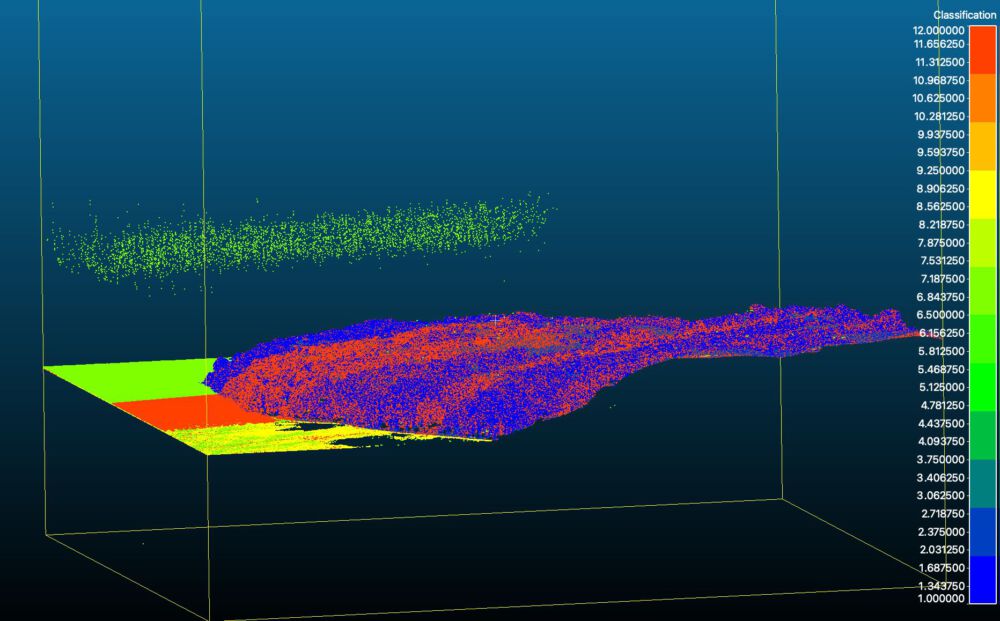
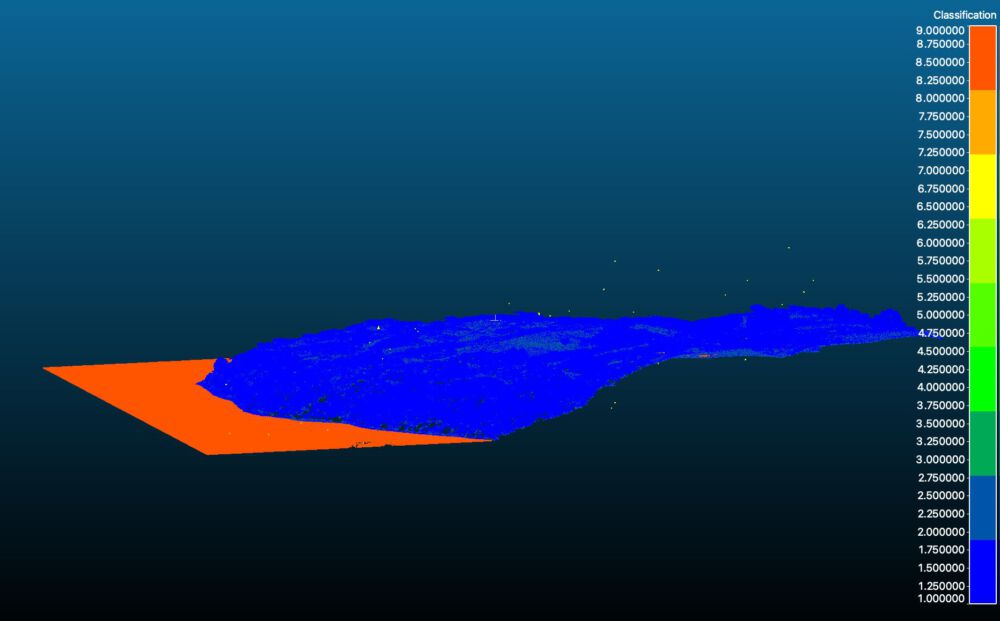
The data is then imported into CloudCompare and visually analyzed. Some false points can be seen in both cloud points, but especially the 2015 data has a lot of nonsenical data points that are removed.
3. Z-Coordinates as Scalar Field
4. Calculating Changes in Height
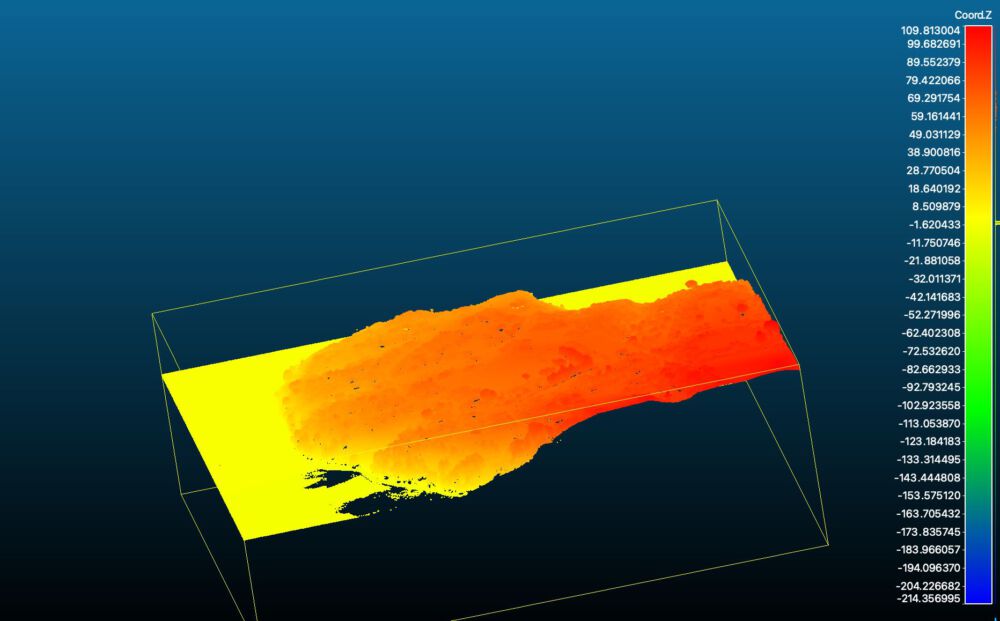
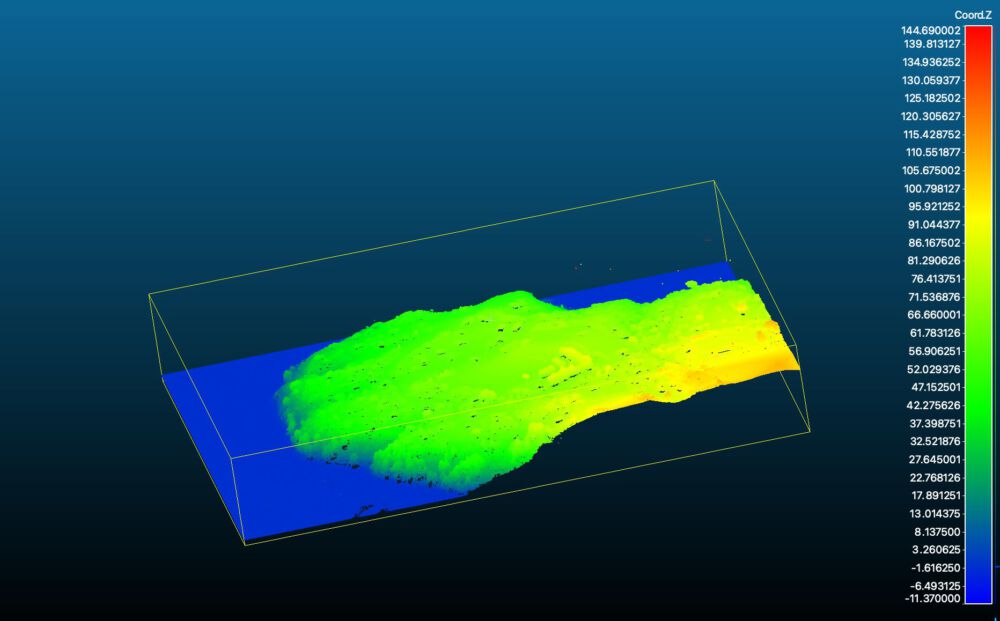
Next up, the difference in height between the two point clouds is calculated (“Cloud Distance”). For each point, the newer point is substracted from the older point, returning the difference in elevation.
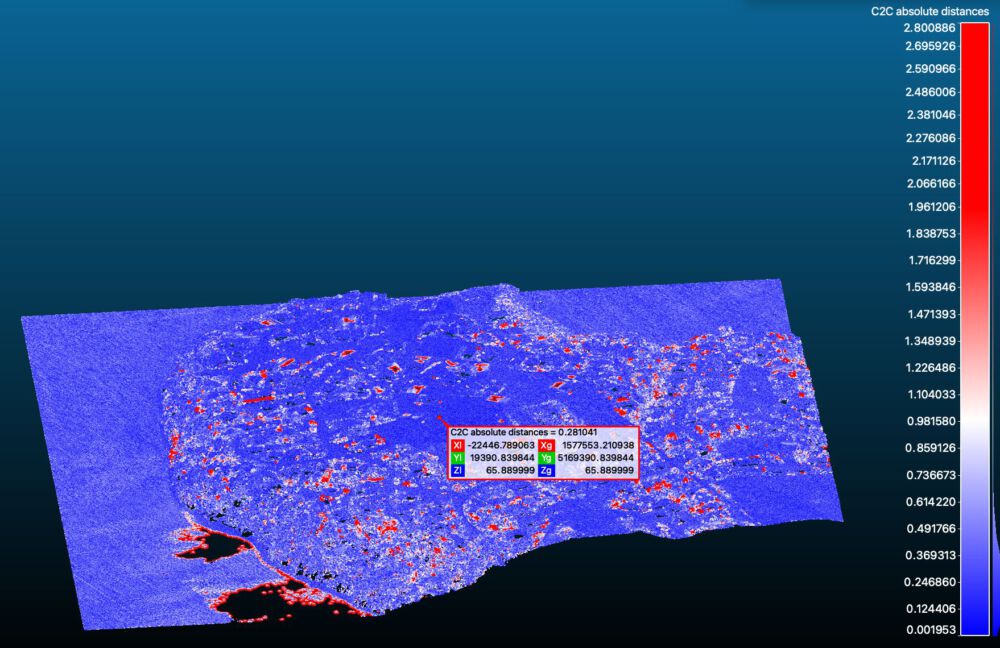
In this study area, there were no points that are negative, meaning that the altitude was lowered. It does not seem like buildings were demolished, additionally the vegetation seems to be in “higher” bloom at the second acquisition date. Some minor alignment errors (upwards) might explain why there is no deviation downwards, but still the result seems to make sense.

