This assignment is tailored around the data acquisition and processing of UAV collected data.
UAV’s (Unmanned Aerial Vehicles, commonly referred t as drones) are a part of UAS (Un- manned Aerial Systems), constituting the flight platform, which is usually remote controlled or provided with previously defined flight paths. The UAS refers to the whole system of the flight platform, control units, Inertia Measurement Units, GNSS receivers and other equip- ment required to complete flight missions.
The advantages of UAS surveying are the hight temporal and spatial resolutions, but as a trade-off only smaller areas than via satellite can be surveyed at a time. A series of overlap- ping images taken by the sensors onboard the UAVs can be used to create 3D models, which is referred to as Photogrammetry. In this exercise, GCPs are used as key points to in- terlink the images of the Olympic Village in Munich, Germany.
The software used is Agisoft’s Metashape, which is used to georeference the images via Ground Control Points and to create a Dense Point Cloud, Orthoimage and DEM.
Analysis of Data
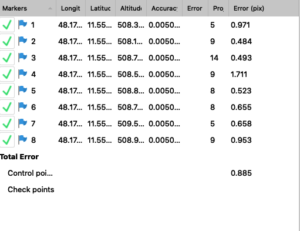
Twenty UAV-aquired images of the Olympic Village in Munich were provided, along with the Coordinates of 8 GCPs and their locations within the images. The images are loaded intoMetashape and aligned. The software is then able to take the location and perspective data of the images (internal and external orientation parameters) in order to create a mosaic and a sparse cloud of the area of interest.
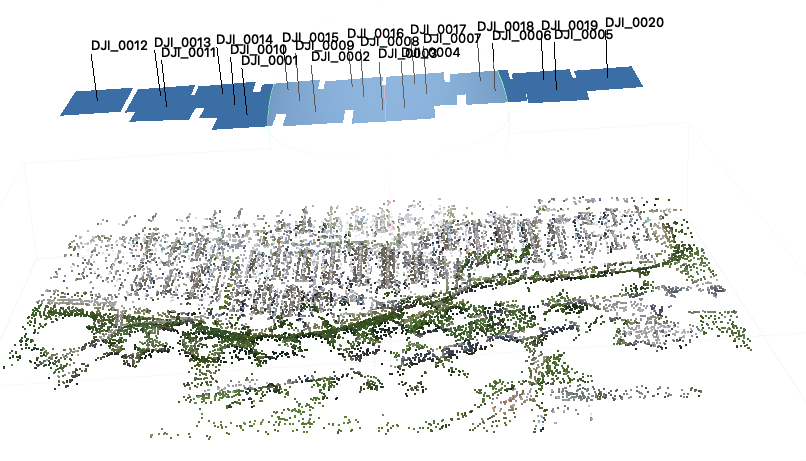
In order to increase accuracy of the image acquisition locations as well as the features on the ground, the GCPs and their coordinates are loaded into Metashape. Consulting infor mation on the GCPs. Namely their positions and optical characteristics, these points can then be found within the images themselves. The GCP position on the images are marked for each point and each image, allowing the software to stitch together the mosaic more accurately.
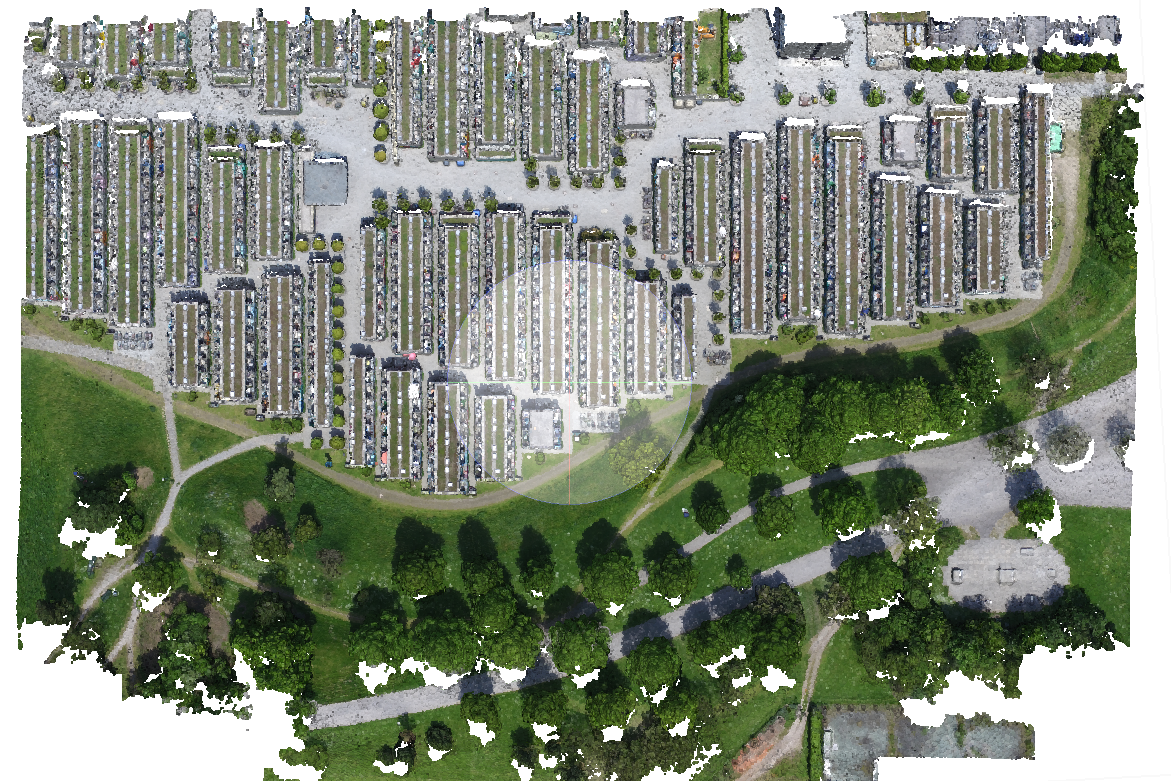
Following that, a dense point clod can be created. It was opted to go for a high accuracy, which creates about 54 million points instead of the 13 million million points of the medium accuracy setting. Even with GPU supported calculation, this took about 45 minutes.
DEM and Orthoimage
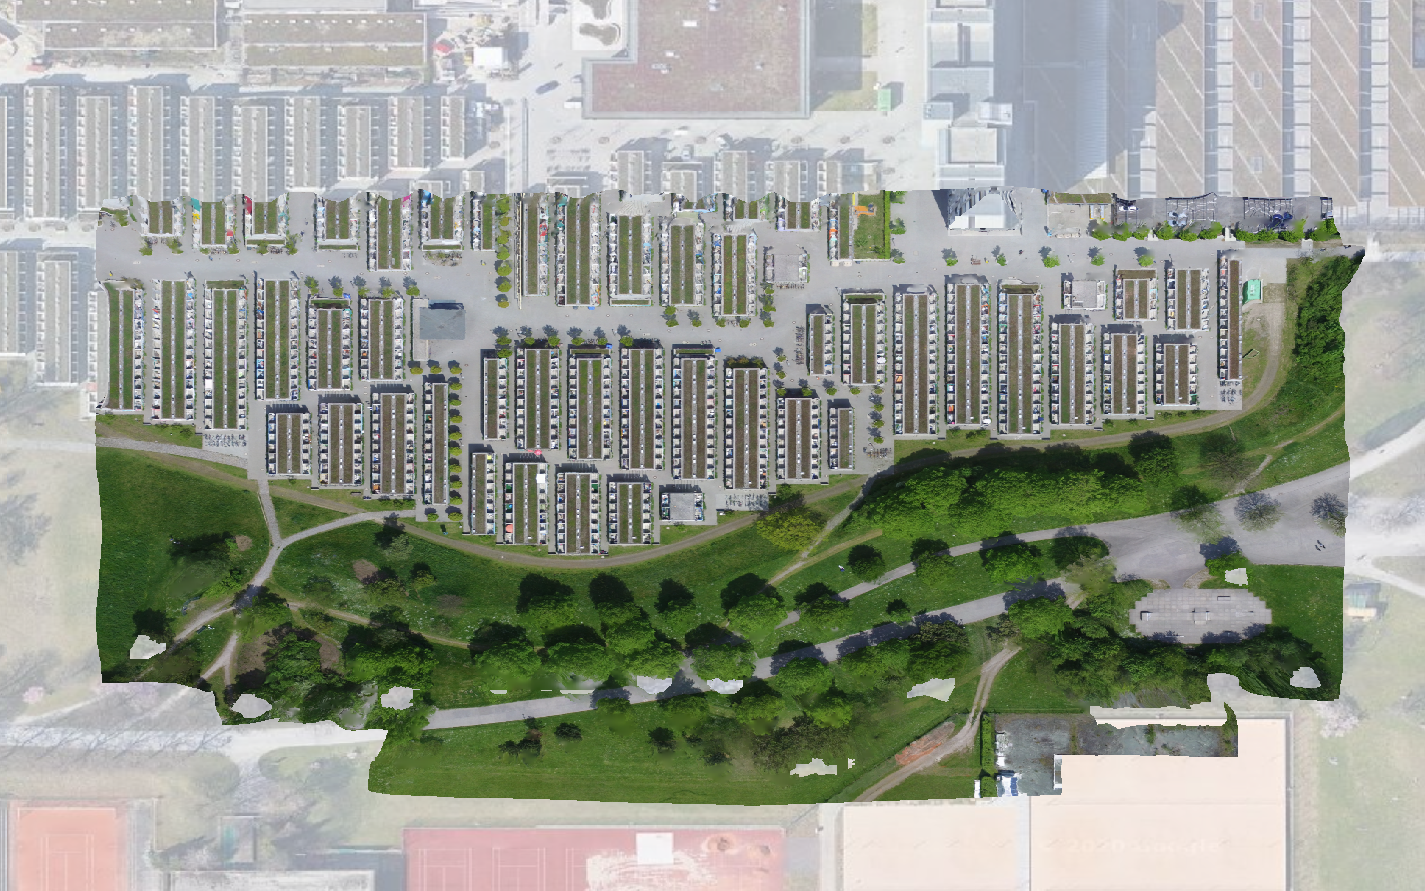
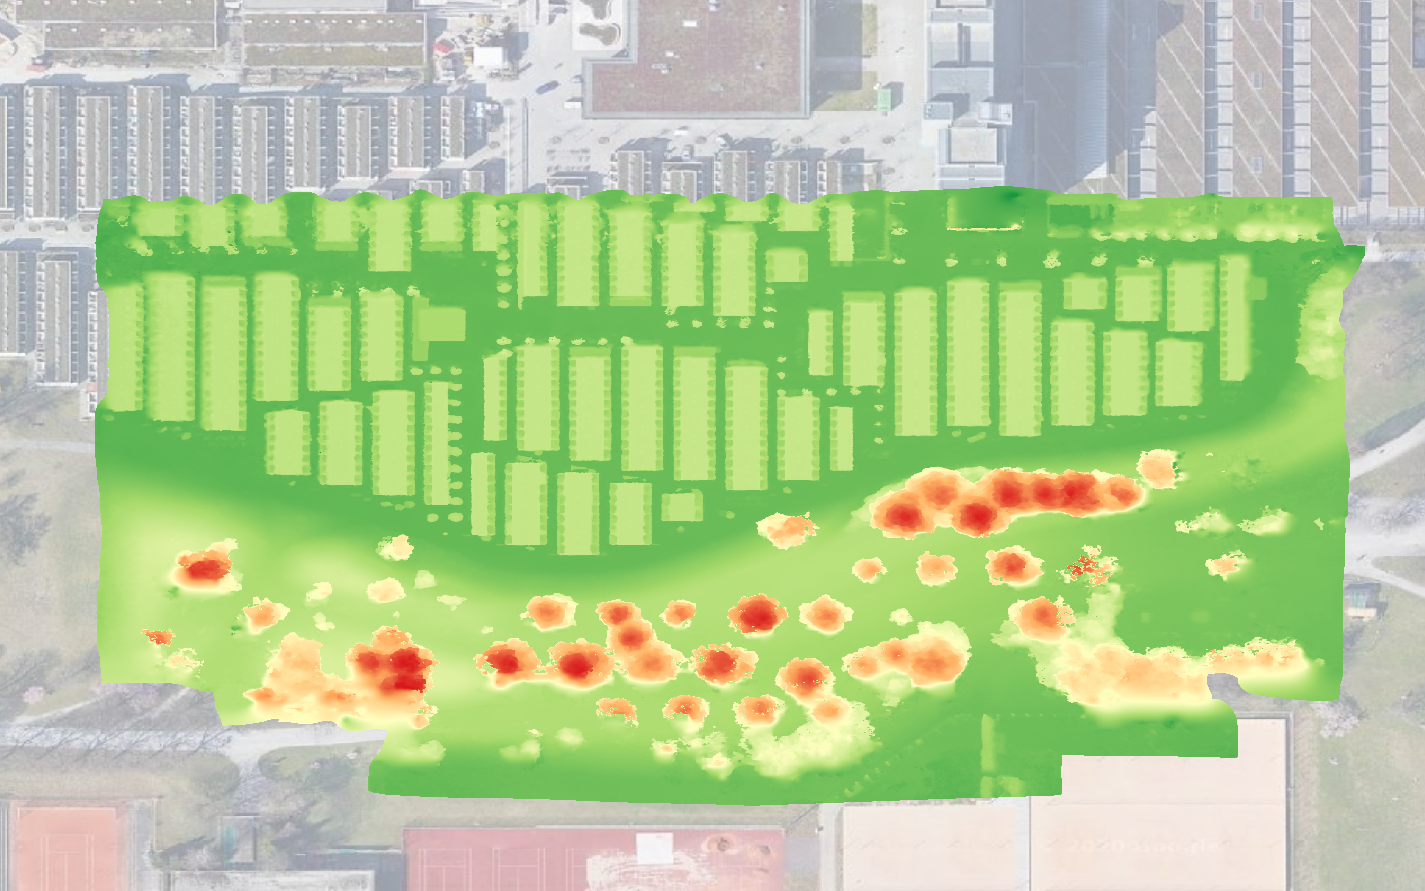
The dense point cloud was then exported both as an orthorectified image tiff (orthoimage) and as a Digital Elevation Model, which contains the Elevation of the pixels. The result- ing .tiff files were consequently loaded into QGIS and visualized.
Conclusion
While working with the data and creating the final result, it became apparent that it is quite a time-consuming task to prepare the flight mission, plan and measure the coordinates of the GCPs as well as carrying out the flight itself. The payoff is the high spatial accuracy as well as the 3D aspect of the data.
Regarding the post-processing, pointing out the GCPs in all images, while keeping their lo- cations in mind, quickly becomes quite a complex task. Other than that, the resulting point clouds are of a very high accuracy, surpassing the accuracy of satellite born methods by far. It would be very interesting to see how post-processed and real time kinematic georef- erencing could accelerate the workflow.
With improving methods in UAS image acquisition, post-processing and georeferencing; it is interesting to see by how much the AOI size can be enlarged until UAS acquisition is not feasible anymore.


