Sentinel EO Browser & Scripting
Script selection from SentinelHub custom script collection
While browsing the collection of scripts available for the visualization of Bands within the EO Browser, the bare soil detector seemed very interesting. I previously worked with bare soil masks, which used the temporal difference from vegetation periods and bare soil periods to identify bare soil pixels. Specifically, the SCMaP (Soil Composite Mapping Processor) defines thresholds for modified NDVI values at different times and looks at the difference in value, using the variance in these values (caused by vegetation periods and subsequent plowing of the area) to iden- tify the areas in question.
Since this Processor has to use imagery form multiple timeframes over the span of certain years but is therefore very accurate, I was very interested in how the same information can be extracted from a single image and how accurately.
The bare „bare soil detector“ script
Investigating the script yielded some interesting results. Firstly, the script uses Bands 2, 3, 4, 5, 7, 8, and 11 to calculate the following indices:
– NDVI (Normalized Difference Vegetation Index)
– (B08-B04) / (B08+B04) -> well known vegetation index
– NBSI (Normalized Bare-Soil Index)
– (B11-B04) / (B08+B02) -> bare soil index, using differences in SWIR and Red bands as well as NIR and Blue bands to deter- mine is pixel can be classified as bare soil
– NDVI RE (Normalized Difference Vegetation Index with Red Edge 3)
– (B08-B07) / (B08+B07) -> NDVI but using Band 7 instead of 4
– CL RE (Chlorophyll Index with Red Edge)
– (B07/B05) – 1 -> used to determine chlorophyll content of vegetation and thus assess the condition of plants
After defining these indices, the authors trained a decision tree using ground data where it is assumed that bare soil is present. The ground data was curated with the help of agriculture experts to identify seeding periods where the soil is bare and then calculating the aforementioned indicies, using those pixel instances where the vegetation index is low but the bare soil index is high as the training dataset. The resulting training dataset included 100.000 Sentinel observations, out of which 2000 features of interest were extracted to serve as test dataset.
Using the decision tree classifier on the test data resulted in accuracies of 80% for grass and clover mixture areas and up to 97% for winter cereals1.
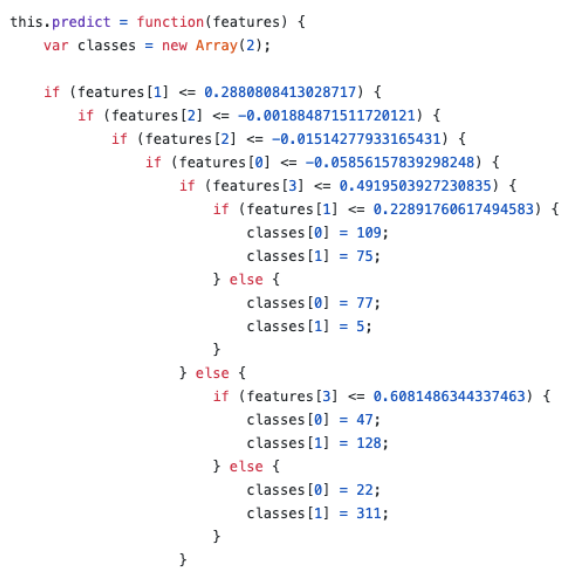
Interestingly, the decision tree that resulted from the training phase was hard- coded into the EO-Browser script.
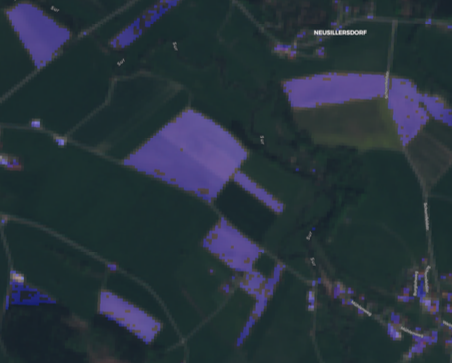
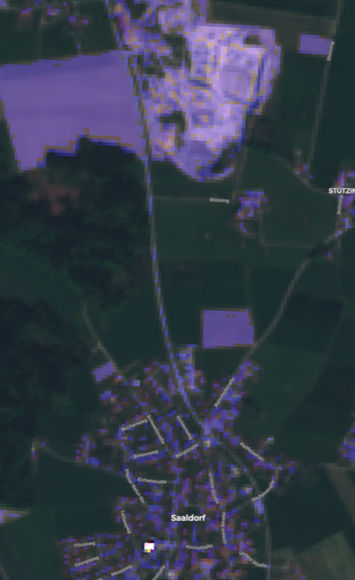
After the classification, the target areas are highlighted within the EO-Browser in a blue shade.
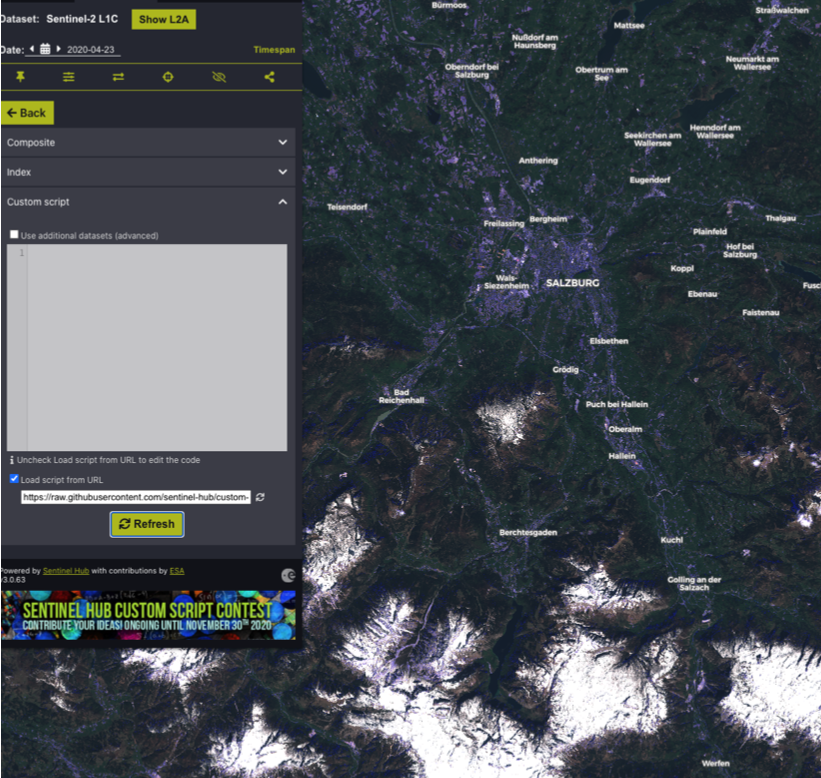
Practical Application of the script within the EO Browser
Conclusion
Visualizing the results, it becomes clear that many areas of bare soil are correctly classified. In fact, false-negatives could not be located anywhere in the study area. On the other hand, quite a lot of false-positives are visible, especially in urban and/ or built-up areas, industrial zones, rail yards, queries and roads. Masking the result with a land use dataset seems appropriate since the aforementioned areas can be filtered out and the distinction between bare soils and vegetation-covered soils seems to work with a high accuracy.
Drawing the comparison with the SCMaP, it becomes clear that this script is not a substitute, but instead shows a snapshot of a certain area at a certain time but with a lower accuracy. This script might be applicable to quickly gain an under- standing and a classification of a certain area, but to receive results with a higher accuracy and on a broader temporal frame, the more complex method of SCMaP needs to be conducted.


