Spatial Data Infrastructure – Dashboard using Flask & Plotly Dash

Introduction

This dashboard was created for the “Spatial Data Infrastructure” course at PLUS in collaboration with Anna Porti Suárez. The dashboard runs on a server that can be accessed via icu-dashboard.donike.net. Please note that the dashboard is optimized for a full-screen browser window on a 1080p screen, mobile devices are not supported. Changing the federal state which the graphs display can be done by hovering over the according state on the map.

We are also thankful to the Open Data Portal Austria for publishing our Dashboard on their list of applications.

Infrastructure

Figure 1: Schema of spatial data infrastructure and their interactions.

The whole infrastructure (see fig. 1) is based around an Ubuntu 16.04 server. On the server, python scripts handle all the data scraping and manipulation. Not only is the percentage calculated, but a join with the administrative boundaries of Austria is also performed. Some dashboard elements, such as the development over the last 7, 14 and 30 days require specific bits of information and is therefore saved separatly in pandas pickle format. The table relevant for the graphs and the map is not only stored locally, but also pushed to a Postgres database running on another private server. There, two tables are automatically updated:

  • A backup copy of all the data scraped so far
  • A table containing the most recent ICU occupancy rates per state and the according geometry

A geoserver running on the university infrastructure has access to the database and publishes the most recent ICU occupancy rates in all standard formats, including as OpenLayers, GeoJSON, csv, shapefile, KML etc.

Additionally to the scraping operations, the server also handles the web interface. An Apache web server handles the communication via HTTP, while Flask (a Python web framework) is used to run the Plotly Dash dashboard. The Plotly Dash platform can be set up and deliver dashboards using exclusively Python commands. HTML tags need to be set via specific python commands using the dash-components library and the content of the graphs and maps is defined the same way that plotly data visualizations are usually handled.

The dashboard pulls the required information from the Geoserver in the GeoJSON format via a HTTP request, the resulting table already contains the geometries of the states and the information required to draw the graphs. Since the Geoserver is the only elements that is not under our full control, in case the connection to the server does not work, the copy stored locally on the server is loaded instead so that the whole infrastructure can continue to operate.

Data flow from source to the finished products

Figure 2: Flow of the data trough the infrastructure.

The data scraped is a .csv file, which is continuously updated by the Austrian authorities. A row is created for each of the federal states as well another row containing all the information combined. Each day, the new data is appended to the end of the list and the list is scraped again. Since the starting date (1st of April 2020) until now (July 2021), over 4600 records have been created.

After scraping, a python script then calculates the ICU occupancy percentage of the new data by comparing the currently occupied ICU beds with the available beds. This information is appended as columns to the data. Additionally, the records are appended with Well-Known binary information representing the geometry of the state they depict. This table is then stored locally and also pushed to the postgis database. The resulting table contains the following information:

  1. testsgesamt: total amount of tests done in the according state
  2. meldedatum: date of last update
  3. fzhosp: COVID patients in stationary treatment
  4. fzicu: COVID patients in ICU care
  5. fzhospfree: free hospital beds
  6. fzicufree: free ICU beds
  7. bundesland: the federal state
  8. hospitalizations_total: the total hospitalisations
  9. icu_capacity: the ICU capacity in absolute numbers
  10. icu_perc: the ICU capacity in relative numbers, calculated by a python script
  11. geometry: the geometry of the elements

Once the connection between the spatial database and the Geoserver is established, the data is ready to be retrieved in different formats, by the usage of the OGC Web Feature Service. Geoserver provides this service in an OGC compliant way (ISO 19142:2010), pulling the information from the spatial database and transforming it into all the common standardized formats.

This dataset is published and  available as WFS via the following link:
https://zgis187.geo.sbg.ac.at/geoserver/IPSDI_WT20/ows?service=WFS&version=1.0.0&request=GetFeature&typeName=IPSDI_WT20%3Aicu_map&maxFeatures=50&outputFormat=application%2Fjson

The according metadata, together with the metadata of the data sources, is uploaded in the ISO 19139 compliant metadata files hosted by the PLUS Z_GIS GeoNetwork catalogue. The XML files are available here: https://git.sbg.ac.at/s1078778/icu_occupancy/-/tree/master/metadata.

Technical Notes

Access the GitLab repository here.

Flask Installation on Server via Apache & WSGI

Following a Tutorial by Harrison Kinsely and sentdex.

Setting up from a fresh Ubuntu 16.04 installation. curl, nano and other functionalities need to be installed separately. SQL installation not strictly necessary. Warning: don’t forget to call “server” as app in WSGI config file.

sudo apt-get update && sudo apt-get upgrade
sudo apt-get install apache2 mysql-client mysql-server
sudo add-apt-repository ppa:deadsnakes/ppa
sudo apt-get update
sudo apt-get install python3.6 python3.6-dev
curl https://bootstrap.pypa.io/get-pip.py | sudo python3.6
sudo apt-get install apache2 apache2-dev
pip3.6 install mod_wsgi
mod_wsgi-express module-config

#returns:
LoadModule wsgi_module "/usr/local/lib/python3.6/dist-packages/mod_wsgi/server/mod_wsgi-py36.cpython-36m-x86_64-linux-gnu.so"
WSGIPythonHome "/usr"

#paste return in:
nano /etc/apache2/mods-available/wsgi.load

a2enmod wsgi
service apache2 restart
pip3.6 install Flask

#paste server info into
nano /etc/apache2/sites-available/FlaskApp.conf

# Paste this into nano
<VirtualHost *:80>
                ServerName 192.168.0.1 # Server IP or Domain Name here
                ServerAdmin youremail@email.com
                WSGIScriptAlias / /var/www/FlaskApp/FlaskApp.wsgi
                <Directory /var/www/FlaskApp/FlaskApp/>
                        Order allow,deny
                        Allow from all
                </Directory>
                ErrorLog ${APACHE_LOG_DIR}/FlaskApp-error.log
                LogLevel warn
                CustomLog ${APACHE_LOG_DIR}/FlaskApp-access.log combined
</VirtualHost>

sudo a2ensite FlaskApp
service apache2 reload

mkdir /var/www/FlaskApp
cd /var/www/FlaskApp
nano FlaskApp.wsgi

# Paste dummy app into nano
#!/usr/bin/python3.6
import sys
import logging
logging.basicConfig(stream=sys.stderr)
sys.path.insert(0,"/var/www/FlaskApp/")


from FlaskApp import app as application

mkdir FlaskApp cd FlaskApp
nano __init__.py

from flask import Flask
import sys

app = Flask(__name__)

@app.route('/')
def homepage():
    return "Hi there, how ya doin?"

if __name__ == "__main__":
    app.run()


service apache2 reload 

Installing and Configuring Plotly Dash in Flask

Install Dash & packages in Python env.

# install dash & components
sudo pip3.6 install dash dash-renderer dash-html-components dash-core-components plotly


hown -R www-data:www-data /var/www/FlaskApp
service apache2 reload 

Requirements.txt file for this environment.

attrs==21.2.0
Brotli==1.0.9
certifi==2020.12.5
chardet==4.0.0
click==7.1.2
click-plugins==1.1.1
cligj==0.7.1
dash==1.20.0
dash-core-components==1.16.0
dash-html-components==1.1.3
dash-renderer==1.9.1
dash-table==4.11.3
dataclasses==0.8
DateTime==4.3
Fiona==1.8.19
Flask==2.0.0
Flask-Compress==1.9.0
future==0.18.2
geojson==2.5.0
geopandas==0.9.0
idna==2.10
itsdangerous==2.0.0
Jinja2==3.0.0
lxml==4.6.3
MarkupSafe==2.0.0
mod-wsgi==4.7.1
munch==2.5.0
numpy==1.19.5
pandas==1.1.5
pandas-datareader==0.9.0
plotly==4.14.3
pycurl==7.43.0
pygobject==3.20.0
pyproj==3.0.1
python-apt==1.1.0b1+ubuntu0.16.4.11
python-dateutil==2.8.1
pytz==2021.1
requests==2.25.1
retrying==1.3.3
Shapely==1.7.1
six==1.16.0
unattended-upgrades==0.1
urllib3==1.26.4
 

__init__.py File defining the Dashboard

import dash
import dash_core_components as dcc
import dash_bootstrap_components as dbc
import dash_html_components as html
import pandas as pd
import plotly.graph_objs as go
import plotly.express as px
import geopandas
import numpy as np
from dash.dependencies import Input, Output
import json
from datetime import datetime,timedelta
external_stylesheets = ['https://codepen.io/chriddyp/pen/bWLwgP.css']
app = dash.Dash(external_stylesheets=[dbc.themes.GRID,dbc.themes.BOOTSTRAP])
app.title = "ICU-Dashboard Austria"
"""
____________________________________________________

"""
"""
LOAD  DATA AND PERFORM MUTATIONS
"""
# load ICU data
df = pd.read_csv("/var/www/FlaskApp/FlaskApp/data/ICU_data.csv",sep=",") #full path neces.

# list of states
states = list(df["Bundesland"].unique())

# list of DFs by states
ls_df = []
for i in states:
    temp = df[df["Bundesland"]==i]
    ls_df.append(temp)

# create list of dicts for droptown menue
options = []
for i in states:
    options.append({"label":i,"value":i})

# get data for most recent day & keep only this data
most_recent_date = df['MeldeDatum'].max()
# save df2 (current date dt)
df2 = pd.read_pickle("/var/www/FlaskApp/FlaskApp/data/df2.pkl")


# get day 7 days ago from last data date, convert to string
most_recent_date_datetime = datetime.strptime(most_recent_date,"%Y-%m-%d")
weekago = most_recent_date_datetime + timedelta(days=-7)
weekago_str = weekago.strftime("%Y-%m-%d")
# get icu perc value 7 days ago
icu_7days = df.loc[(df["MeldeDatum"]==weekago_str) & (df["Bundesland"]=="Alle")]["ICU_perc"]
icu_7days = float(icu_7days.to_string(index=False))
# get icu percentage today
icu_today = df.loc[(df["MeldeDatum"]==most_recent_date) & (df["Bundesland"]=="Alle")]["ICU_perc"]
icu_today = float(icu_today.to_string(index=False))
# calculate percentage difference from a week ago to today
icu_dif = round(icu_today-icu_7days,2)
#icu_dif = 2.5
# set color for text according to rising/falling
if icu_dif <=0:
	icu_dif_col = "#008000"
else:
	icu_dif_col = "#8B0000"
	icu_dif = "+"+str(icu_dif)

# load json file containing state geometries
#df_map =geopandas.read_file("/var/www/FlaskApp/FlaskApp/data/austria_adm1.geojson")

# join geometries with most recent data per state
#df_map["Bundesland"] = df_map["NAME_1"]
#df_map = pd.merge(df2,df_map,on="Bundesland")
#df_map = geopandas.GeoDataFrame(df_map, geometry="geometry")
df_map = pd.read_pickle("/var/www/FlaskApp/FlaskApp/data/df_map.pkl")


"""
____________________________________________________

"""
"""

CREATE MAP FIGURE
"""

# make map figure
fig_map = px.choropleth(df_map,geojson=df_map.geometry,color_continuous_scale="reds",range_color=[0,100],
    projection="equirectangular",locations=df_map.index,color="ICU_perc",hover_data=["Bundesland","ICU_perc"],width=800, height=600)
    
fig_map.update_geos(fitbounds="locations",visible=True,
    resolution=110,
    showcoastlines=True, coastlinecolor="Black",
    showland=True, landcolor="LightGray",
    showocean=True, oceancolor="LightBlue",
    showlakes=False, lakecolor="Blue",
    showrivers=False, rivercolor="Blue",
    showcountries=False,countrycolor="Black"
    )
fig_map.update_layout(title_text="Current ICU Occupancy Percentage by State ("+str(most_recent_date)+")")
#fig_map.update_layout(autosize=False)

"""
LOAD DFs FOR UPDATE GRAPHS
"""
df_perc = pd.read_pickle("/var/www/FlaskApp/FlaskApp/data/df_perc.pkl")
df_FZICU = pd.read_pickle("/var/www/FlaskApp/FlaskApp/data/df_FZICU.pkl")
df_ICU_cap = pd.read_pickle("/var/www/FlaskApp/FlaskApp/data/df_ICU_cap.pkl")

"""
CREATE GRAPH OBJECTS
"""

fig_graph = go.Figure()
fig_graph = px.line(df_perc, x="MeldeDatum",y="Alle",title="ICU Occupancy Timeline in all states combined - Percentage",
        labels={"MeldeDatum": "Date"})
fig_graph.update_yaxes(range=[0,100])
fig_graph_FZICU = go.Figure()
fig_graph_FZICU.add_trace(go.Scatter(x=df_FZICU["MeldeDatum"],y=df_FZICU["Alle"],name="ICU beds w/ COVID-19 Patients",
    mode="lines",line=go.scatter.Line(color="red"),showlegend=True))
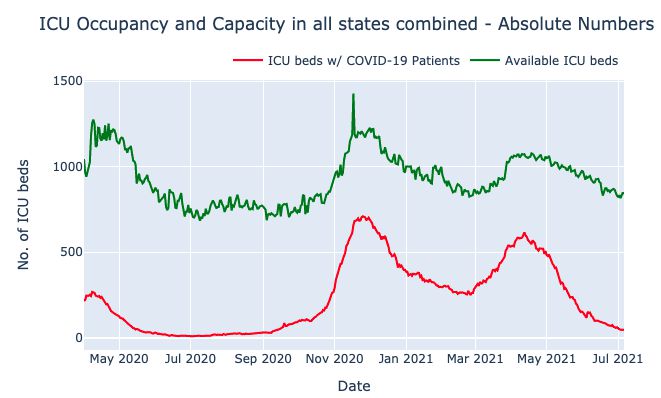
fig_graph_FZICU.add_trace(go.Scatter(x=df_ICU_cap["MeldeDatum"],y=df_ICU_cap["Alle"],name="Available ICU beds",
    mode="lines",line=go.scatter.Line(color="green"),showlegend=True))
fig_graph_FZICU.update_layout(title_text="ICU Occupancy and Capacity in all states combined - Absolute Numbers",
    xaxis_title="Date",
    yaxis_title="No. of ICU beds",)
fig_graph_FZICU.update_layout( legend=dict(
    orientation="h",
    yanchor="bottom",
    y=1.02,
    xanchor="right",
    x=1,
))


"""
CREATE PIE CHART DATA AND FIG
"""
#df_pie = df.loc[df['MeldeDatum'] == most_recent_date]
#df_pie = df_pie[df_pie.Bundesland == 'Alle']

#fig_pie = px.pie(df_pie, values='FZICU', names='FZICUFree')
#fig_pie = px.pie()
"""
____________________________________________________

"""
"""
APP LAYOUT
"""
styles = {
    'pre': {
        'border': 'thin lightgrey solid',
        'overflowX': 'scroll'
    }
}

Col1 = dbc.Col([
      
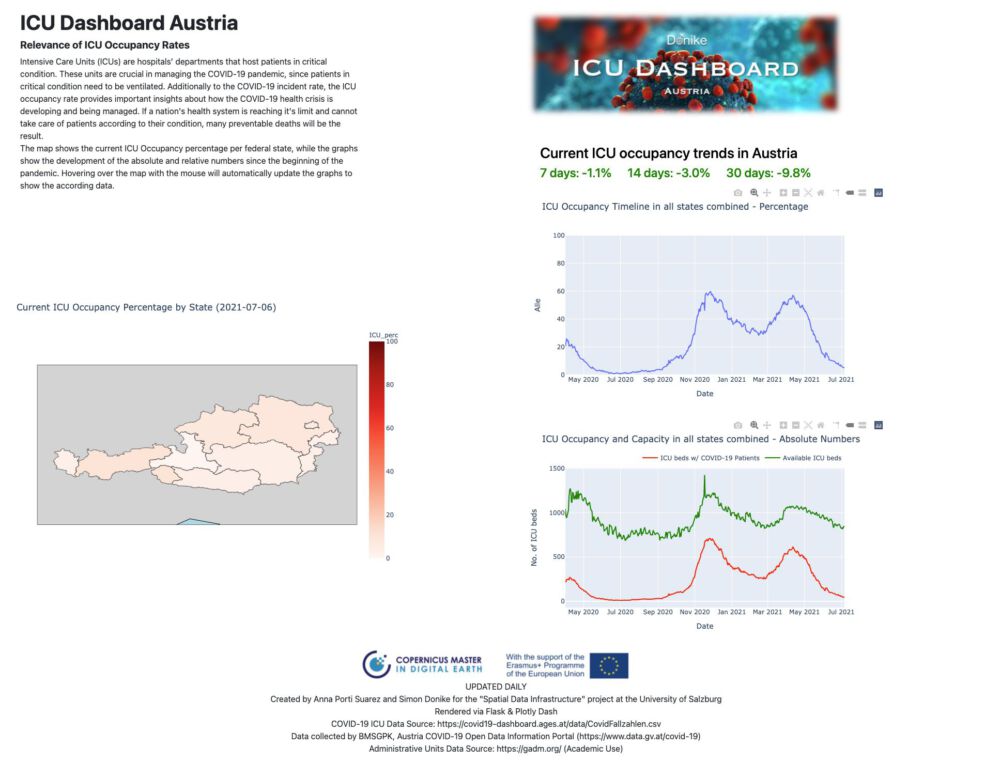
      dbc.Row([html.H1("ICU Dashboard Austria",style={'font-weight': 'bold'})]),
      dbc.Row([
               html.H5("Relevance of ICU Occupancy Rates",style={'font-weight': 'bold'}),
	       html.Div("Intensive Care Units (ICUs) are hospitals’ departments that host patients in critical condition. These units are crucial in managing the COVID-19 pandemic, since patients in critical condition need to be ventilated. Additionally to the COVID-19 incident rate, the ICU occupancy rate provides important insights about how the COVID-19 health crisis is developing and being managed. If a nation's health system is reaching it's limit and cannot take care of patients according to their condition, many preventable deaths will be the result.",style={'width': '70%'}),
	       html.Div("The map shows the current ICU Occupancy percentage per federal state, while the graphs show the development of the absolute and relative numbers since the beginning of the pandemic. Hovering over the map with the mouse will automatically update the graphs to show the according data.", style={'width': '70%'}),

               ]),    
      dbc.Row([
              
                html.Div([
                    dcc.Graph(id="map1", figure=fig_map,style={"vertical-align":"middle",'margin-top':'25%'}),
                    ], style={"text-align":"center",'margin-left':'-5%'}),

               ]),   
    ])
Col2 = dbc.Col([

      #image ICU DASHBOARD
      dbc.Row([
             html.Div([
              html.A([
              html.Img(src="https://www.donike.net/wp-content/uploads/corona_Dashboard_Cover_2.jpg",style={'height':'100%', 'width':'100%'} )
              ], href='https://www.donike.net'),
              ],style={'margin-left':'1%','padding-bottom':'8%'})
            ]),

     dbc.Row([
               html.H4('7-day ICU Occupancy trend in Austria: '+str(icu_dif)+'%', style={'color': icu_dif_col,"text-align":"center",'margin-left':'5%'}),
            ]),
     

      dbc.Row([
              html.Div([
              dcc.Graph(id="graph_icu",figure=fig_graph,style={'width': '100%'}),
              dcc.Graph(id="graph_FZICU",figure=fig_graph_FZICU,style={'width': '100%'}),
              ]),
            ]),

    ])


app.layout = html.Div([
        dbc.Row([
                dbc.Col(Col1, width=6,style={'margin-left' : '2%'}),
                dbc.Col(Col2, width=4),  
            ]),
        dbc.Row([
              # Footer
              html.Div([
              html.Img(src="https://www.donike.net/wp-content/uploads/copernicus_eu_logos_combined.jpg", style={'width':'60%','textAlign':'center'}),
              html.P(['UPDATED DAILY',
		  html.Br(),'Created by Anna Porti Suarez and Simon Donike for the "Spatial Data Infrastructure" project at the University of Salzburg',
                  html.Br(),'Rendered via Flask & Plotly Dash',
                  html.Br(),"COVID-19 ICU Data Source: https://covid19-dashboard.ages.at/data/CovidFallzahlen.csv",
                  html.Br(),"Data collected by BMSGPK, Austria COVID-19 Open Data Information Portal (https://www.data.gv.at/covid-19)",
                  html.Br(),'Administrative Units Data Source: https://gadm.org/ (Academic Use)'],
                  style={'textAlign': 'center'})
              ],style={'textAlign': 'center'})


                ], justify="center")
    ],style={'margin-top' : '1%'}
    
)


 # close app layout div


"""
____________________________________________________

"""


""" # Callback for PERC graph
@app.callback(
    Output(component_id='graph_icu', component_property='figure'),
    Input(component_id='dropdown',component_property="value") #, component_property='value')
    )
def update_output_div(input_value):
    if input_value == "Alle":
        name = "all states combined"
    else:
        name=input_value
    fig_graph = px.line(df_perc, x="MeldeDatum",y=input_value,title="ICU Occupancy Timeline in "+name+" - Percentage",
        labels={"MeldeDatum": "Date"})
    fig_graph.update_yaxes(range=[0,100])
    #fig.graph.update_layout(xaxis_title="Date",yaxis_title="ICU Occupancy Percentage")
    return fig_graph """

""" # Callback for absolute numbers graph
@app.callback(
    Output(component_id='graph_FZICU', component_property='figure'),
    Input(component_id='dropdown',component_property="value") #, component_property='value')
    )
def update_output_div(input_value):
    if input_value == "Alle":
        name = "all states combined"
    else:
        name=input_value
    #fig_graph_FZICU = px.line(df_FZICU, x="MeldeDatum",y=input_value,title="ICU Occupancy and Capacity in "+name+" - Absolute Numbers")
    fig_graph_FZICU = go.Figure()
    fig_graph_FZICU.add_trace(go.Scatter(x=df_FZICU["MeldeDatum"],y=df_FZICU[input_value],name="ICU beds w/ COVID-19 Patients",
        mode="lines",line=go.scatter.Line(color="red"),showlegend=True))
    fig_graph_FZICU.add_trace(go.Scatter(x=df_ICU_cap["MeldeDatum"],y=df_ICU_cap[input_value],name="Available ICU beds",
        mode="lines",line=go.scatter.Line(color="green"),showlegend=True))
    fig_graph_FZICU.update_layout(title_text="ICU Occupancy and Capacity in "+name+" - Absolute Numbers",
        xaxis_title="Date",
        yaxis_title="No. of ICU beds",)
    fig_graph_FZICU.update_layout(legend=dict(
        orientation="h",
        yanchor="bottom",
        y=1.02,
        xanchor="right",
        x=1
    ))
    return fig_graph_FZICU """

# Callback for PERC graph Test

@app.callback(
    Output(component_id='graph_icu', component_property='figure'),
    Input('map1', 'hoverData'))
def display_hover_data(hoverData):
    x = json.dumps(hoverData, indent=2, ensure_ascii=False)
    y = x.split('"customdata": [')[1].strip().split('",')[0].strip('"')
    name = "all states combined"
    input_value = "Alle"

    if hoverData:
        name=y
        input_value = y
        
    fig_graph = px.line(df_perc, x="MeldeDatum",y=input_value,title="ICU Occupancy Timeline in "+name+" - Percentage",
        labels={"MeldeDatum": "Date"})
    fig_graph.update_yaxes(range=[0,100])

    #fig.graph.update_layout(xaxis_title="Date",yaxis_title="ICU Occupancy Percentage")
    return fig_graph


    # Callback for absolute numbers graph
@app.callback(
    Output(component_id='graph_FZICU', component_property='figure'),
    Input('map1', 'hoverData'))
def update_output_div(hoverData):
    x = json.dumps(hoverData, indent=2, ensure_ascii=False)
    y = x.split('"customdata": [')[1].strip().split('",')[0].strip('"')

    #default_value == "Alle"

    name = "all states combined"
    input_value = "Alle"

    if hoverData:
        name=y
        input_value = y
        

    #fig_graph_FZICU = px.line(df_FZICU, x="MeldeDatum",y=input_value,title="ICU Occupancy and Capacity in "+name+" - Absolute Numbers")
    fig_graph_FZICU = go.Figure()
    fig_graph_FZICU.add_trace(go.Scatter(x=df_FZICU["MeldeDatum"],y=df_FZICU[input_value],name="ICU beds w/ COVID-19 Patients",
        mode="lines",line=go.scatter.Line(color="red"),showlegend=True))
    fig_graph_FZICU.add_trace(go.Scatter(x=df_ICU_cap["MeldeDatum"],y=df_ICU_cap[input_value],name="Available ICU beds",
        mode="lines",line=go.scatter.Line(color="green"),showlegend=True))
    fig_graph_FZICU.update_layout(title_text="ICU Occupancy and Capacity in "+name+" - Absolute Numbers",
        xaxis_title="Date",
        yaxis_title="No. of ICU beds",)
    fig_graph_FZICU.update_layout(
    legend=dict(
        orientation="h",
        yanchor="bottom",
        y=1.02,
        xanchor="right",
        x=1
    ))
    return fig_graph_FZICU


"""
# Callback for Pie Chart from Map Hover
@app.callback(
    Output(component_id='fig_pie', component_property='figure'),
    Input(component_id='fig_map',component_property="hover")
    )
def update_pie(input_value):
    if input_value is None:
        fig_pie = go.Figure(data=[go.Pie(labels=labels, values=values)])
        return fig_pie
"""


"""
____________________________________________________

"""
"""
SERVER SETTINGS
"""
# added this
server = app.server

if __name__ == '__main__':
    app.run_server(debug=True)
 

Scraper file

# csv URL
url = "https://covid19-dashboard.ages.at/data/CovidFallzahlen.csv"

# read csv from URL
import pandas as pd
import geopandas as gpd
import numpy as np
df=pd.read_csv(url,sep=";")
df.to_csv("data/covid_data.csv",sep=";",index=False)

# transforming timestamps to proper DateTime format
import datetime as dt
from datetime import datetime
import time
timestamps = []
for i in df["MeldeDatum"]:
    i = i.replace(".","")
    i = i.replace(":","")
    timestamps.append(dt.datetime.strptime(i, "%d%m%Y %H%M%S"))
df["MeldeDatum"] = timestamps
df = df.drop(["Meldedat"], axis=1)

# get List of State Names
states = list(df["Bundesland"].unique())

# append total hospitalizations to DF
l_temp = []
for a,b in zip(df["FZHosp"],df["FZICU"]):
    l_temp.append(a+b)
df["Hospitalizations_total"] = l_temp

# append total ICU capacity to DF
l_temp = []
for a,b in zip(df["FZICU"],df["FZICUFree"]):
    l_temp.append(a+b)
df["ICU_capacity"] = l_temp

# append ICU occupancy percentages to DF
l_temp = []
for a,b in zip(df["FZICU"],df["ICU_capacity"]):
    try:
        l_temp.append(100.0 * float(a)/float(b))
    except ZeroDivisionError:
        l_temp.append(0.0)
df["ICU_perc"] = l_temp

# create list of dataframes by Bundesland
ls_df = []
for i in states:
    temp = df[df["Bundesland"]==i]
    ls_df.append(temp)
    
# importing adm0 and adm1 shapefilesas geopandas dataframes
adm1 = gpd.read_file("data/gadm36_AUT_1.shp")
adm0 = gpd.read_file("data/gadm36_AUT_0.shp")

#writing to json
#adm1.to_file("data/austria_adm1.geojson", driver="GeoJSON")
#adm0.to_file("data/austria_adm0.geojson", driver="GeoJSON") 

# save CSV after manipulating & rounding
df = df.round(1)
df.to_csv("data/ICU_data.csv")

# create most recent DF for map
most_recent_date = df['MeldeDatum'].max()
df2 = df.loc[df['MeldeDatum'] == most_recent_date]
df2.to_pickle("data/df2.pkl")

# join geometries with most recent data per state
df_map =gpd.read_file("data/austria_adm1.geojson")
df_map["Bundesland"] = df_map["NAME_1"]
df_map = pd.merge(df2,df_map,on="Bundesland")
df_map = gpd.GeoDataFrame(df_map, geometry="geometry")
df_map.to_pickle("data/df_map.pkl")
# drop unused columns and save file in data folder
df_map.drop(["BundeslandID","GID_0","NAME_0","NAME_1","GID_1","VARNAME_1","NL_NAME_1","TYPE_1","ENGTYPE_1","CC_1","HASC_1","test_value"],axis=1).to_csv("data/df_map.csv",index=False)


"""
CREATE DFs FOR UPDATE GRAPHS
"""
df_perc = pd.DataFrame({
    "MeldeDatum": np.asarray(df.loc[df['Bundesland'] == "Alle"]["MeldeDatum"]),
    "Alle": np.asarray(df.loc[df['Bundesland'] == "Alle"]["ICU_perc"]),
    "Burgenland": np.asarray(df.loc[df["Bundesland"] == "Burgenland"]["ICU_perc"]),
    "Kärnten": np.asarray(df.loc[df['Bundesland'] == "Kärnten"]["ICU_perc"]),
    "Niederösterreich": np.asarray(df.loc[df["Bundesland"] == "Niederösterreich"]["ICU_perc"]),
    "Oberösterreich": np.asarray(df.loc[df['Bundesland'] == "Oberösterreich"]["ICU_perc"]),
    "Salzburg": np.asarray(df.loc[df["Bundesland"] == "Salzburg"]["ICU_perc"]),
    "Steiermark": np.asarray(df.loc[df['Bundesland'] == "Steiermark"]["ICU_perc"]),
    "Tirol": np.asarray(df.loc[df["Bundesland"] == "Tirol"]["ICU_perc"]),
    "Vorarlberg": np.asarray(df.loc[df['Bundesland'] == "Vorarlberg"]["ICU_perc"]),
    "Wien": np.asarray(df.loc[df["Bundesland"] == "Wien"]["ICU_perc"]),
})
df_perc.to_pickle("data/df_perc.pkl")

df_FZICU = pd.DataFrame({
    "MeldeDatum": np.asarray(df.loc[df['Bundesland'] == "Alle"]["MeldeDatum"]),
    "Alle": np.asarray(df.loc[df['Bundesland'] == "Alle"]["FZICU"]),
    "Burgenland": np.asarray(df.loc[df["Bundesland"] == "Burgenland"]["FZICU"]),
    "Kärnten": np.asarray(df.loc[df['Bundesland'] == "Kärnten"]["FZICU"]),
    "Niederösterreich": np.asarray(df.loc[df["Bundesland"] == "Niederösterreich"]["FZICU"]),
    "Oberösterreich": np.asarray(df.loc[df['Bundesland'] == "Oberösterreich"]["FZICU"]),
    "Salzburg": np.asarray(df.loc[df["Bundesland"] == "Salzburg"]["FZICU"]),
    "Steiermark": np.asarray(df.loc[df['Bundesland'] == "Steiermark"]["FZICU"]),
    "Tirol": np.asarray(df.loc[df["Bundesland"] == "Tirol"]["FZICU"]),
    "Vorarlberg": np.asarray(df.loc[df['Bundesland'] == "Vorarlberg"]["FZICU"]),
    "Wien": np.asarray(df.loc[df["Bundesland"] == "Wien"]["FZICU"]),
})
df_FZICU.to_pickle("data/df_FZICU.pkl")

df_ICU_cap = pd.DataFrame({
    "MeldeDatum": np.asarray(df.loc[df['Bundesland'] == "Alle"]["MeldeDatum"]),
    "Alle": np.asarray(df.loc[df['Bundesland'] == "Alle"]["ICU_capacity"]),
    "Burgenland": np.asarray(df.loc[df["Bundesland"] == "Burgenland"]["ICU_capacity"]),
    "Kärnten": np.asarray(df.loc[df['Bundesland'] == "Kärnten"]["ICU_capacity"]),
    "Niederösterreich": np.asarray(df.loc[df["Bundesland"] == "Niederösterreich"]["ICU_capacity"]),
    "Oberösterreich": np.asarray(df.loc[df['Bundesland'] == "Oberösterreich"]["ICU_capacity"]),
    "Salzburg": np.asarray(df.loc[df["Bundesland"] == "Salzburg"]["ICU_capacity"]),
    "Steiermark": np.asarray(df.loc[df['Bundesland'] == "Steiermark"]["ICU_capacity"]),
    "Tirol": np.asarray(df.loc[df["Bundesland"] == "Tirol"]["ICU_capacity"]),
    "Vorarlberg": np.asarray(df.loc[df['Bundesland'] == "Vorarlberg"]["ICU_capacity"]),
    "Wien": np.asarray(df.loc[df["Bundesland"] == "Wien"]["ICU_capacity"]),
})
df_ICU_cap.to_pickle("data/df_ICU_cap.pkl")

# Writing to logfile
file_object = open('log.txt', 'a')
now = datetime.now() # current date and time
date_time = now.strftime("%m/%d/%Y, %H:%M:%S")
file_object.write('Success:  '+date_time+"\n")
file_object.close()


"""

DB CONNECTOR

"""

# DB create string from csv for COVID data
import csv
with open('data/covid_data.csv', 'r') as f:
    instr = ""
    reader = csv.reader(f,delimiter=";")
    #print(reader)
    next(reader) # Skip the header row.
    for row in reader:
        instr=instr+("INSERT INTO icu_data VALUES ('"+str(row[0])+"','"+str(row[1])+"','"+str(row[2])+"','"+str(row[3])+"','"+str(row[4])+"','"+str(row[5])+"','"+str(row[6])+"','"+str(row[7])+"','"+str(row[8])+"');" )                

# DB create string from csv for MAP data
import csv
import sys
csv.field_size_limit(sys.maxsize)
with open('data/df_map.csv', 'r') as f:
    instr_map = ""
    reader = csv.reader(f,delimiter=",")
    #print(reader)
    next(reader) # Skip the header row.
    for row in reader:
        instr_map=instr_map+("INSERT INTO icu_map VALUES ('"+str(row[0])+"','"+str(row[1])+"','"+str(row[2])+"','"+str(row[3])+"','"+str(row[4])+"','"+str(row[5])+"','"+str(row[6])+"','"+str(row[7])+"','"+str(row[8])+"','"+str(row[9])+"','"+str(row[10])+"');" )

""" connecting to DB, parsing SQL statements """
def csv_parser(statement):
    import psycopg2
    return_ls = []
    try:
       connection = psycopg2.connect(user="icu_bot",
                                      password="XXXXXXXXXXXX", #contact simon@donike.net 
                                      host="85.214.150.208",
                                      port="5432",
                                      database="ICU")
       cursor = connection.cursor()
       sql_Query = statement
       #print(sql_Query)
       cursor.execute(sql_Query)
       connection.commit()
       #print("Selecting rows from mobile table using cursor.fetchall")
       #mobile_records = cursor.fetchall() 
       
       #print("Print each row and it's columns values")
       #for row in mobile_records:
       #    return_ls.append(list(row))
    
    except (Exception, psycopg2.Error) as error :
        print ("Error while fetching data from PostgreSQL: ", error)
    
    finally:
        #closing database connection.
        if(connection):
            cursor.close()
            connection.close()
            #print("PostgreSQL connection is closed")
    
    return return_ls


# update database in postgis
csv_parser("DELETE FROM icu_data")
csv_parser(instr)

# Update map data in server
csv_parser("DELETE FROM icu_map")
csv_parser(instr_map)


"""
GeoServer Connector
"""
try:
	df_geojson = pd.read_json("https://zgis187.geo.sbg.ac.at/geoserver/IPSDI_WT20/ows?service=WFS&version=1.0.0&request=GetFeature&typeName=IPSDI_WT20%3Aicu_map&maxFeatures=50&outputFormat=application%2Fjson")
	df_geojson.to_pickle("data/df_geojson.pkl")
except:
	print("an exception occured connecting to the geoserver")
 

Leave a Reply

Your email address will not be published. Required fields are marked *

Further Reading
Recent Updates