
This blogpost gives short overviews over the topics discussed in the Selected Topics in Geoinformatics Lecture. Instead of summaries of 10 of the 12 lectures, brief personal statements and opinions on the topics are given by outlining my personal take-home message from each lecture.
Tourism, Environment and Big EO Data
Lixia Chu introduced her research, which uses data such as vegetation changes, land surface temperature und land cover matrixes in order to assess the ecological impact that comes with tourism. It is an interesting approach not only to use land cover classification in order to observe urban sprawl, but to use other traditional EO data to gain further insights. The idea to introduce said data into the approach leads to a new understanding. Observing areas with a considerable tourism increase and the comparison to other areas introduce classical RS techniques to a new field of application, which in general shows that the data we already have and create every day can be used in many ways and is long from being completely exploited, since new application domains are created constantly.

Spatial Energy Planning
Even though the whole presentation was quite interesting and outlined the process of getting, cleaning, verifying data and the underlying concepts, the main take-home message from this presentation was how the data was integrated to the database of the application. Hearing real-life examples of the preparation of data is always welcome, since in academic learning environments the data provided is usually quite clean and meaningful already. Hearing about the exact steps necessary to go from a cadastre register to the final database and the steps performed in between is something new. Especially the way the rules were created, for example how polygons/houses within certain lots are assumed to be on the same plot and therefore owned by the same person was interesting.

Semantic EO Data Cubes
The challenge of ever-growing EO data is cleverly tackled by semantic EO Data cubes. Previously, we were lucky enough to work with the Sen2Cube created here at the University of Salzburg (Article might still be password-protected, permission to publish the blog post is still pending). Generally, it enables a whole new approach to satellite imagery, moving away from the static image that has to be downloaded, stored and then analyzed. By having the temporal dimension of a certain location within the datacube, the thinking shifts towards the location itself, away from the snapshot in time that a single image provides. Additionally, the ModelBuilder and the immediate creation of derivates and indexes from the images create a very smooth analysis experience.

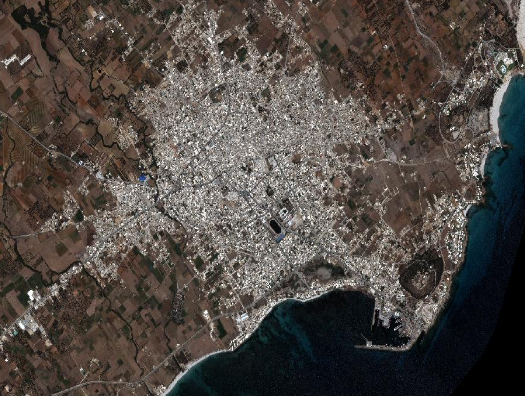
Monitoring Urban Dynamics using GIS and RS
In general, the application of RS data to monitor urban sprawl is not a new concept and a classical application for satellite imagery. It was interesting to be talked through the process and the concepts behind it, as well as how city building policies and permits can be combined with RS data to control said regulations. But most memorable for me personally was the information about the building of models and their verification.
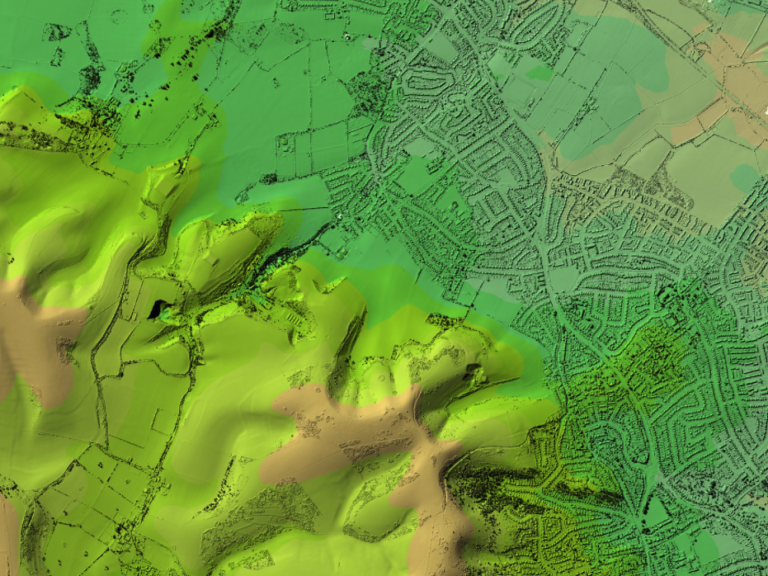
Land Suitability Assessment in GIS
Within the general application domain of urban planning and sustainability analysis in general, for me personally it was interesting to see the implementation of an extension into the ArcGIS Software. Learning about the special demands and expectations that went into the extension and then being led through the extension and tit’s many options illustrated the possibilities of customization and “formalization” of specific demands. Mainly, I learned that customization through programming your own extensions is possible and allows even non-experts to use the complex concepts and algorithms behind it.
Recent Trends in Cartography
Even though the lecture interestingly outlined differences in perceiving colors and shapes as well as some general cartography concepts, most interesting for me was the raising of the ethics involved in creating maps. Of course it is not new that certain abstractions and simplifications have to be made when creating maps, but the idea that a map can be technically correct but still misrepresent the truth was something I had not previously put much thought into. In the domain of statistics these “errors” can be seen more often, such as not zeroing the y-axis and therefore misrepresenting the differences between two data points. But now, I will pay closer attention to the same issues within the mapping domain, since the example given of the misrepresentation of UK voting results by using geographical data without taking population centers into account was very impressive.
From 2D Maps to 4D Web Communication
Learning about the way geodata is transformed from 2D top-down maps, over 2.5 D towards 3D environments depicting shadows, internal building/infrastructure models in general was interesting but not new. Especially interesting was the transfer of polygons is a new concept which I never thought about, basically deciding if the polygon is draped on the ground leading to inaccurate depictions of water bodies for example or if they should be “floating” over the surface, connecting the shoreline to the underlaying DSM/DEM. Additionally, the water effect layer could also not only be a polygon but a 3D object, defining those coordinates above the DSM but under the surface as “under water”. Another interesting object was the extraction of roof heights, where it is necessary to think about the placement of the roof polygon, since a square of the roof would not be an accurate representation of an angled roof.
GDAL – Geospatial Data Abstraction Language
the Geospatial Data Abstraction Library is something that i was previously aware of and used under the supervision of the DLR, since it enables very quick processing without the detour through QGIS (which basically only offers the GUI for GDAL algorithms). The commands themselves and the possibilities of GDAL are known to me, but especially interesting was the mention of an Apache HTTP Server that can serve tiles based on GDAL-created rasters using leaflet. This is a very interesting approach that offers many possibilities for web applications. It is very good to know that these possibilities exist and should the need arise, I know where to start looking.

Optimized Geodata Acquisition Practices for Municipal Applications
Hearing about the ways Municipalities are involved in the collection and usage of cadastre, population and land cover data gives an insight into the applications of said data and more general, the reason why this type of data is collected in the first place. The in-depth introduction to the Dubai Municipality is especially intriguing, since the city did not grow “generically” but instead incredibly fast, raising the question how policymakers, cartographers and urban planners can keep up with the incredible pace of development. Additionally, I was not aware of how while conceptualizing and collection the data, the needs of industry and businesses are taken into account, since the data will be made publicly available through open data laws.

Movement Analysis: Extracting Information from Trajectories
When thinking of Lines or Poly-Lines within a GIS/Geoinformatics context, usually it is perceived as quite static. Either delineating entities such as countries, representing e.g. roads, or tracing the movement of a certain object. When taking the temporal dimension into account, the context of discourse grows considerably, enabling a whole new dimension of possible analyses. While investigating A. Graser’s blog further, I also stumbled upon an implementation of integrating trajectories in Postgres databases called MobilityDB, which introduces a whole new abstract data type representing the evolution of a certain variable over time.

All images on this page are for visualization purposes only and properly licensed or license-free.
¹ Open Government License


