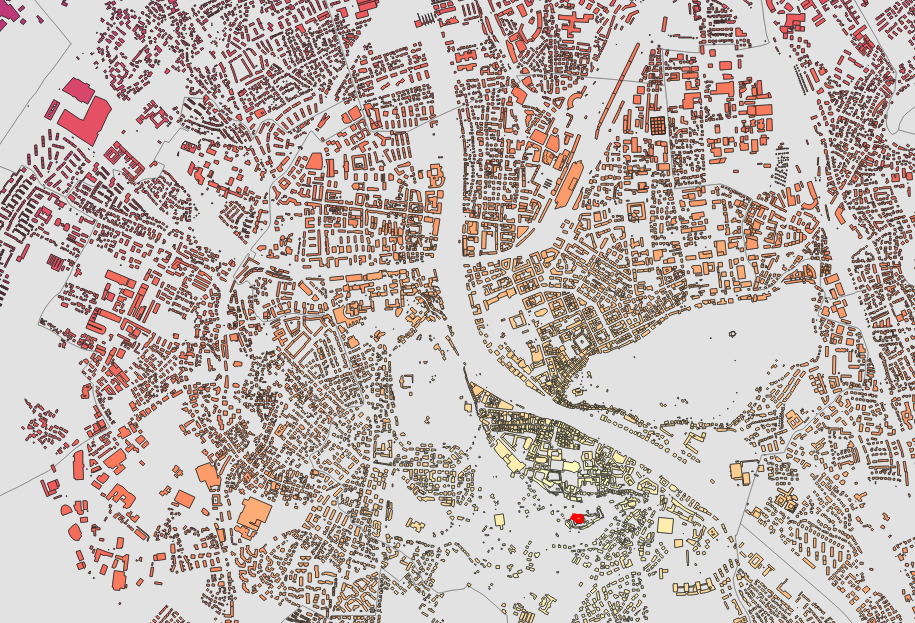
Visibility and Viewshed Analysis
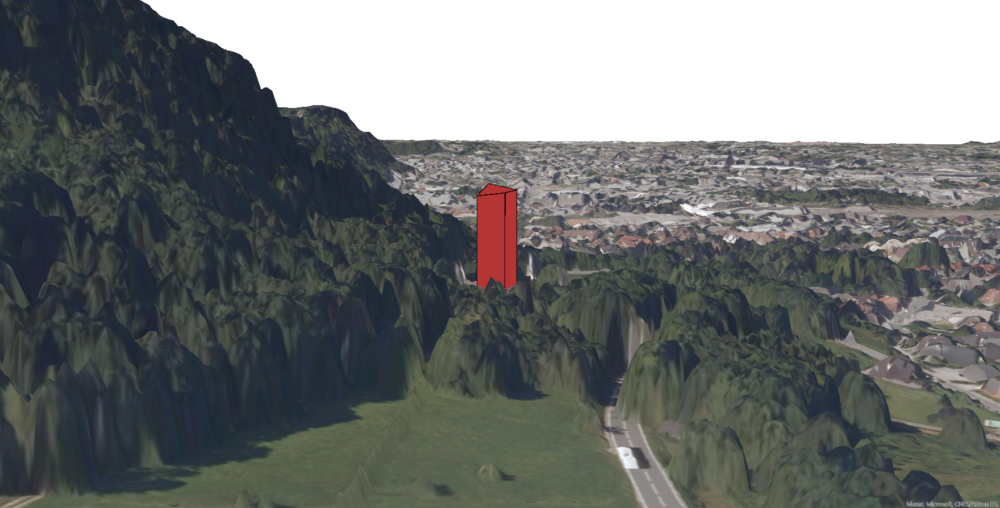
In this project, an imaginary high-rise hotel building proposal is analysed regarding it’s visual impact on the city of Salzburg. Viewshed analysis and Line-of-Sight Analysis are performed.
Managing Roles in PostgreSQL

In this exercise, some role managing and security operations are performed. Roles are created, given permissions and view queries created that allow managing the restriction of information within a database.
Surface Runoff Analysis
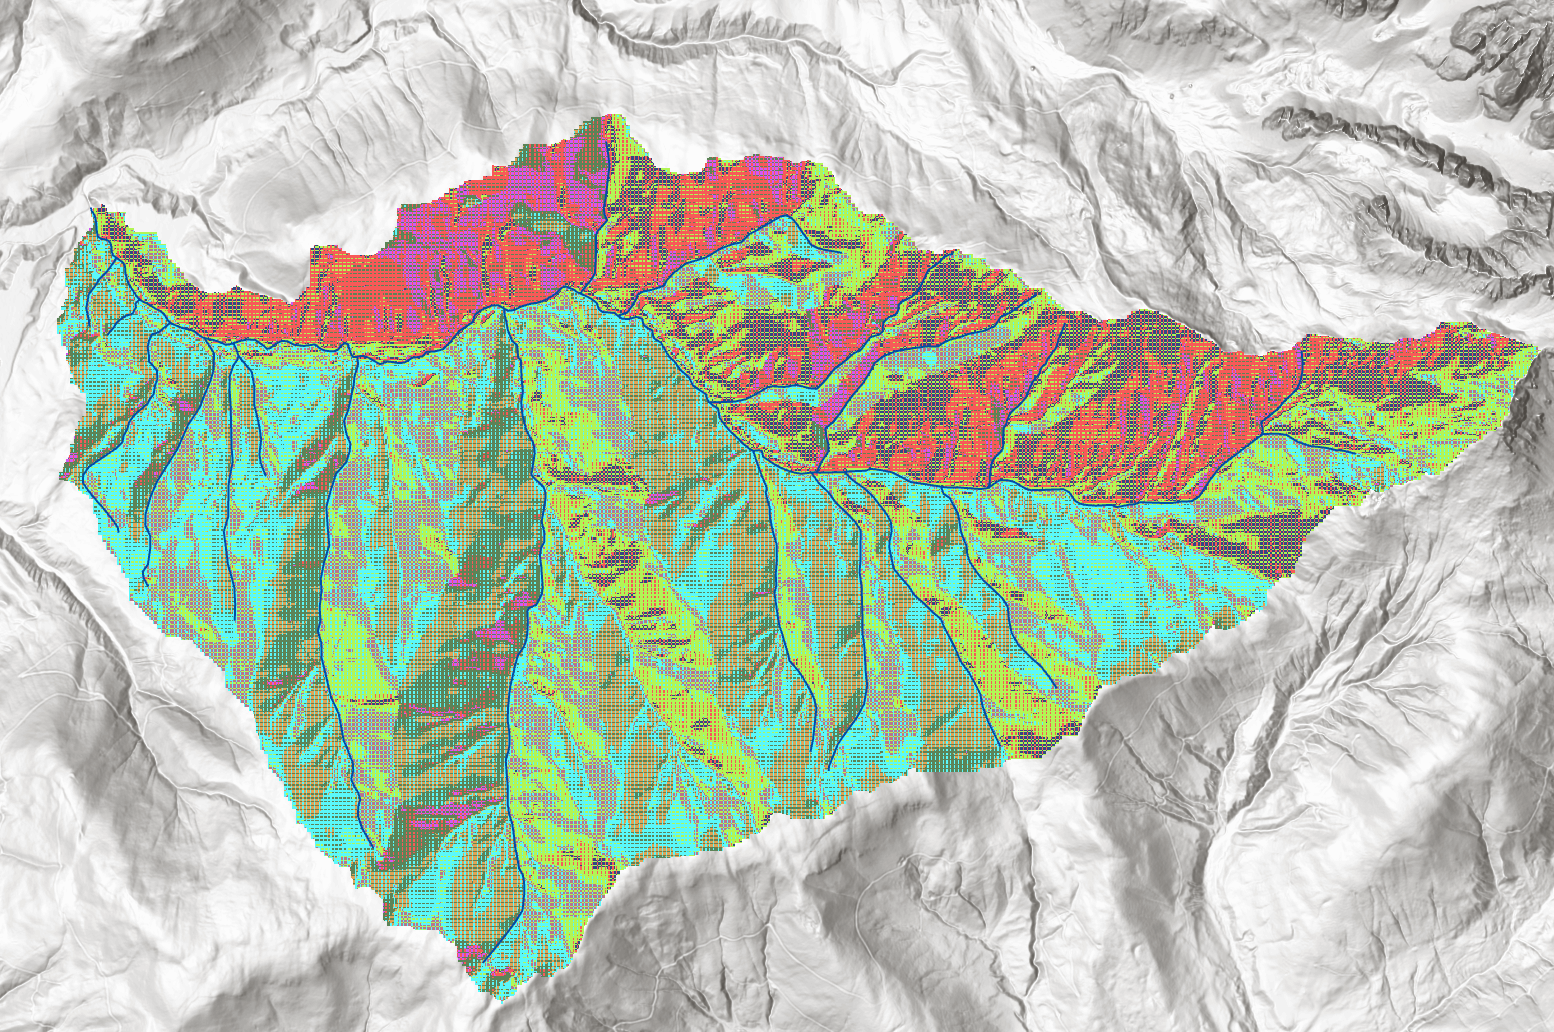
In this post, the Neubach catchment area is analyzed again, this time focusing on surface runoff parameters such as flow lengths, flow accumulations and runoff times.
SQL for Spatial Queries
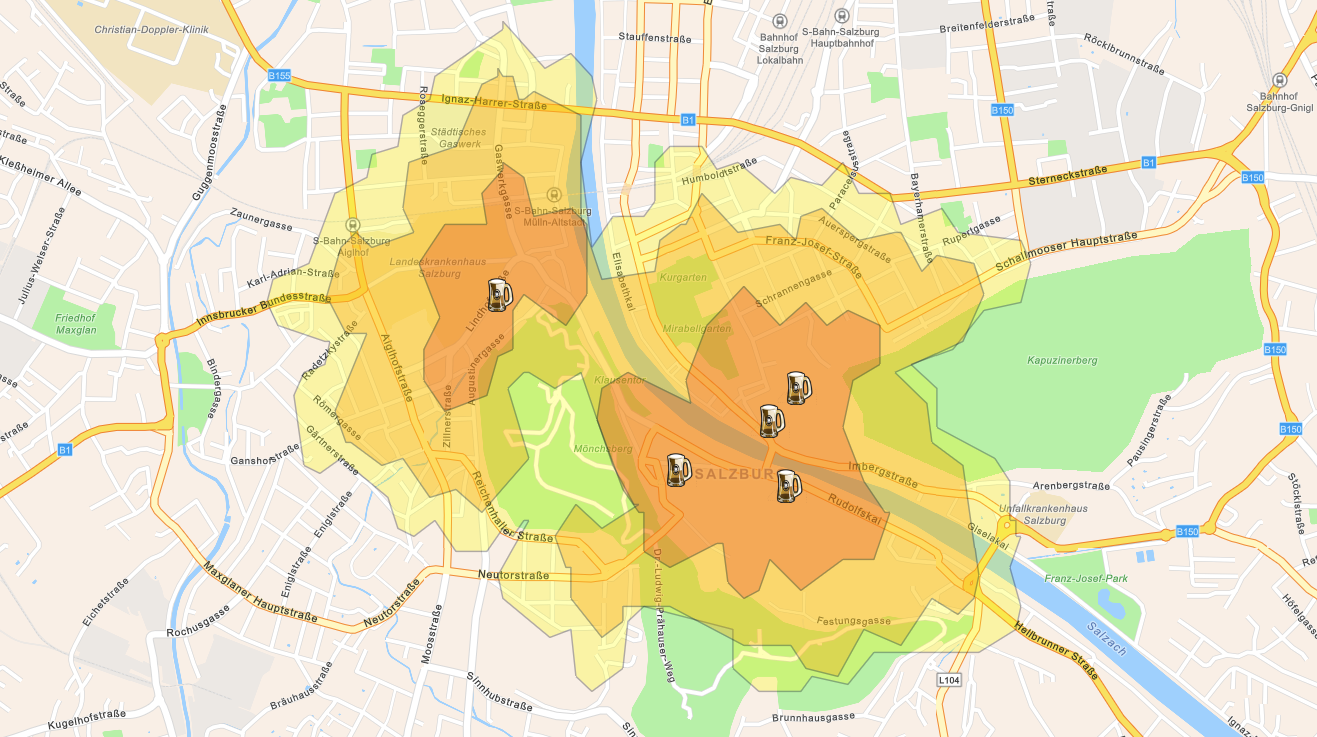
In this exercise, some basic GIS functionalities are performed with SQL/PostGIS commands, such as Union, Intersect and Buffer.
Terrain Analysis
This Post focuses on analyzing a river catchment area, producing slope and curvature statistics and visualizations.
Google Earth Engine – Charts
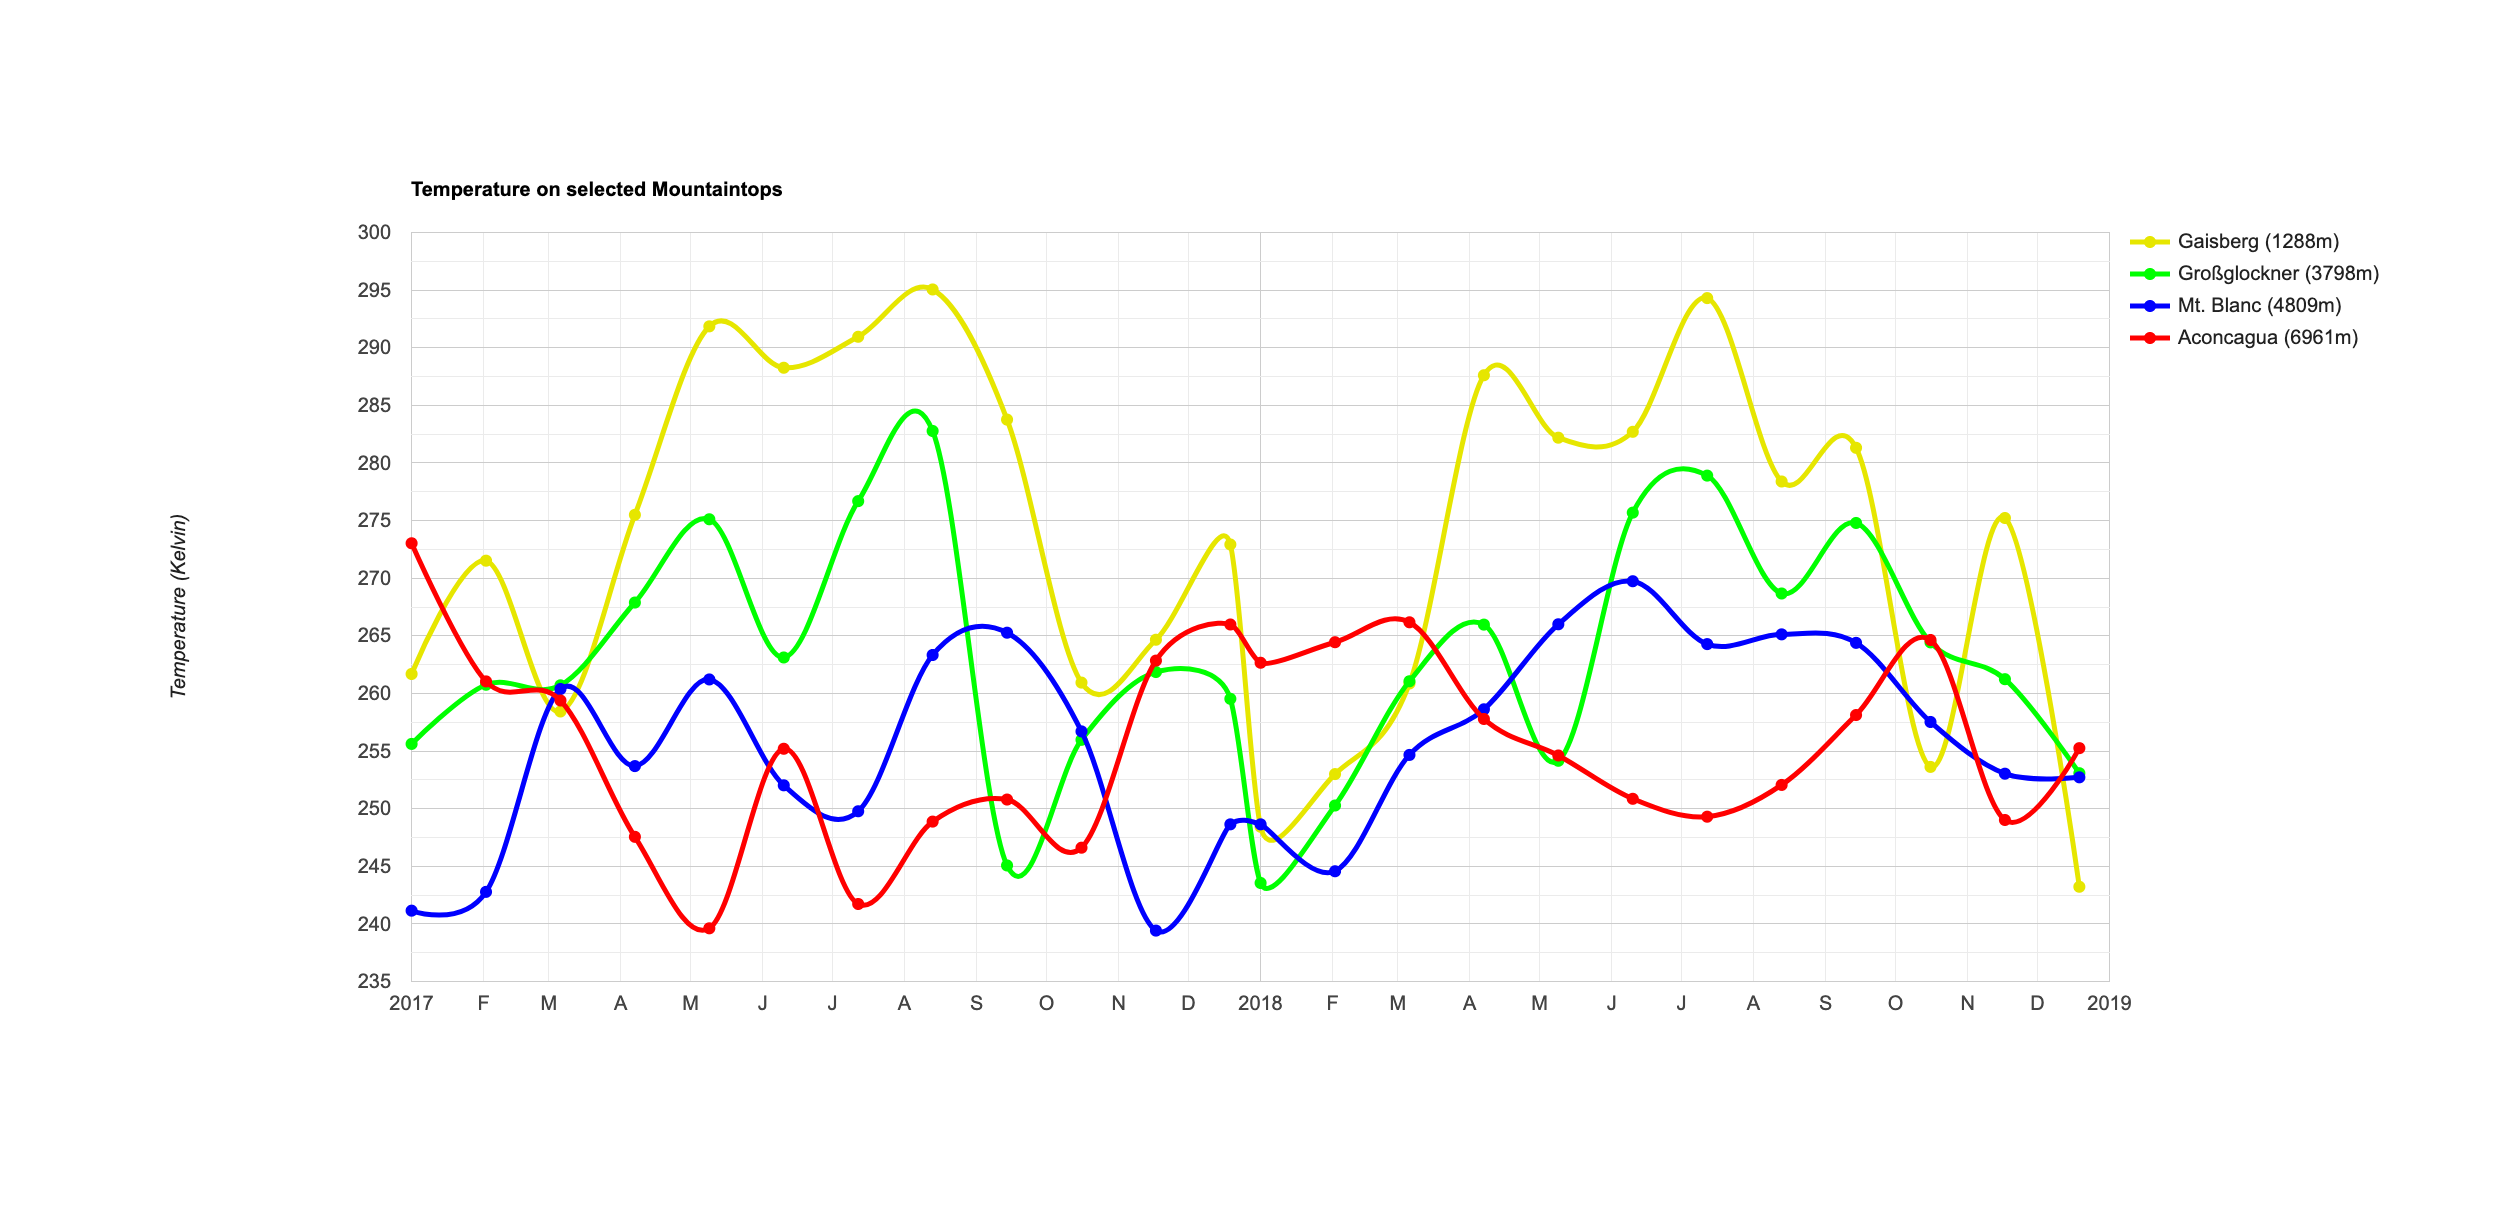
This post shows both the code and the result from Google Earth Engine’s reduced Charts by region for 4 selected mountaintops around the world.
PostgreSQL & PostGIS – First Steps
The DBMS PostgreSQL and the geospatial extension PostGIS are used to load Shapefiles into QGIS and perform SQL querries.
Interpolation – IDW
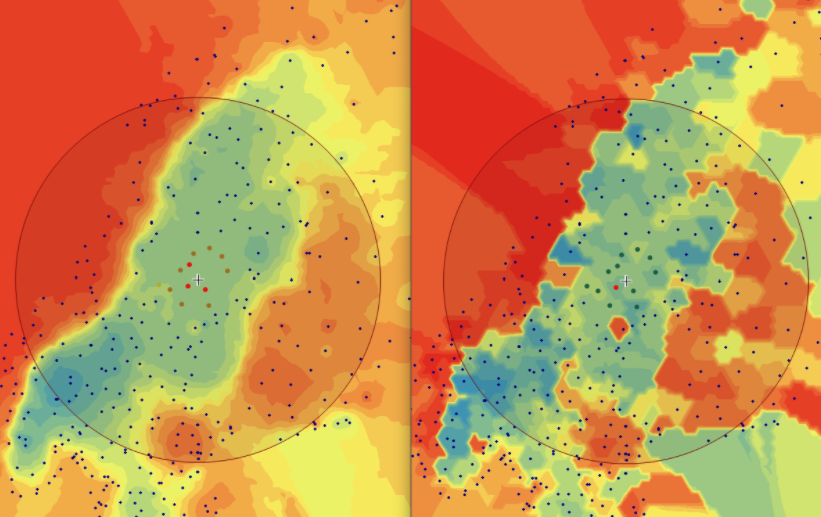
This exercise deals mainly with the IDW method and its parameters, calculating the temperature gradient across Fenoscandia. Also, IDW quality measures are discussed.
UAV Photogrammetry
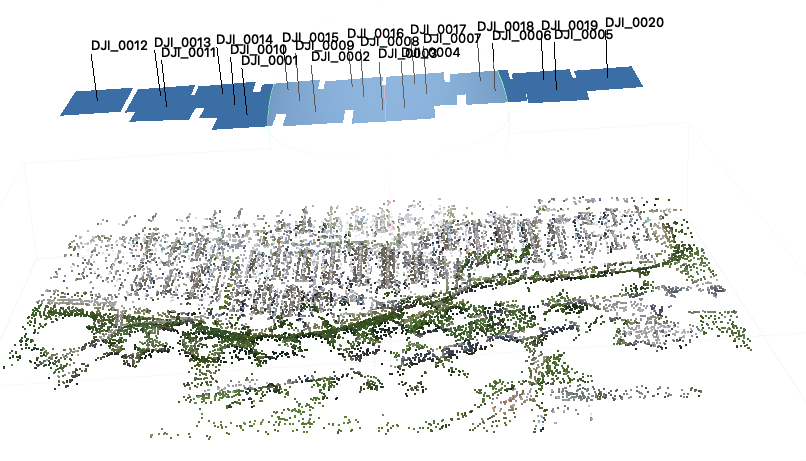
In this Assignment, a workflow is followed that creates a dense point cloud, Orthoimage and DEM from UAV data in Munich, Germany.
Network Analysis – Story Map
This ESRI ArcOnline Story Map shows the result of the “Network Analysis” assignment of the Methods in Spatial Analysis class.